Bitcoin Price Analysis: BTC Rally Loses Steam as Historical Resistance Comes Into Play
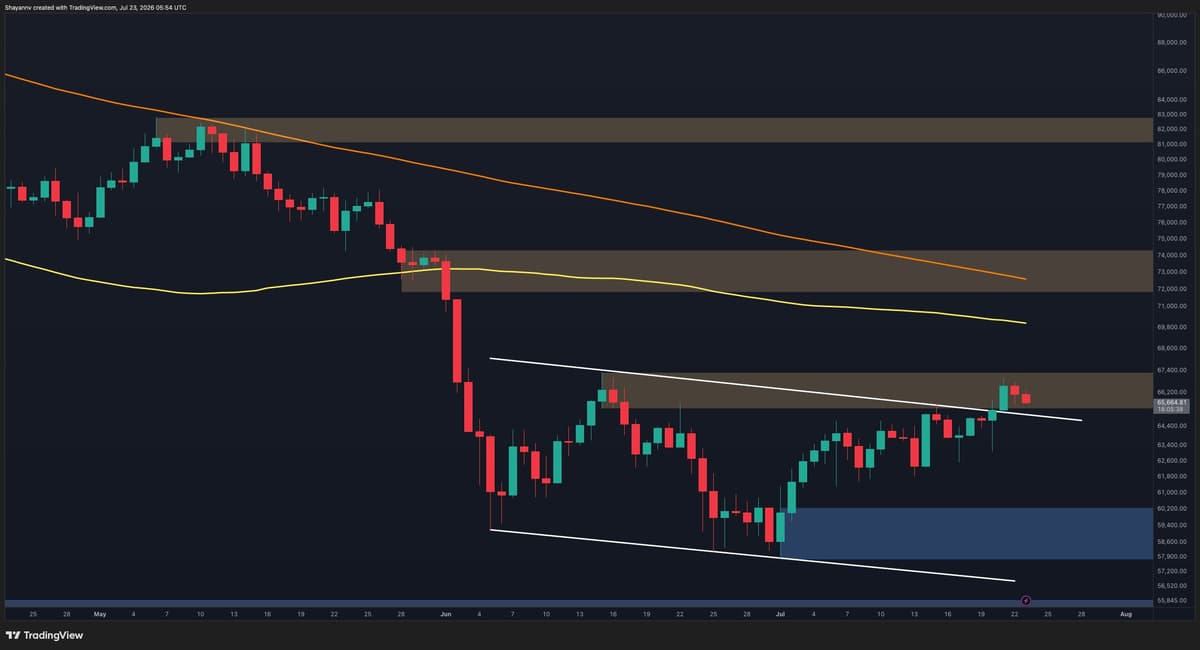
Bitcoin’s latest rally has carried the asset back into an area where sellers have previously regained control. The coming sessions should reveal whether this recovery has enough strength to continue or if another rejection is waiting around the corner.
Bitcoin Price Analysis: The Daily Chart
On the daily timeframe, BTC has extended its recovery into the $65.5K-$66.7K supply zone after successfully reclaiming the descending trendline that had capped the price action for weeks. While this breakout represents a notable improvement in market structure, the broader trend remains constrained beneath the declining 100-day moving average, with the 200-day moving average positioned even higher.
The current resistance zone also coincides with a previous distribution area, increasing the likelihood of seller activity around current levels. A decisive daily close above $66.7K would strengthen the bullish case and expose the next resistance around $72K-$74K.
On the downside, the former breakout area near $63K-$64K now serves as the first demand zone. As long as BTC holds above this region, buyers remain in short-term control. Losing this support would shift attention back toward the broader demand zone around $58K-$59.5K, where the latest impulsive rally originated.
… Continue reading the full article at the original source below.