Bitcoin just hit a decade-low S&P 500 correlation, but the daily data tells a different story
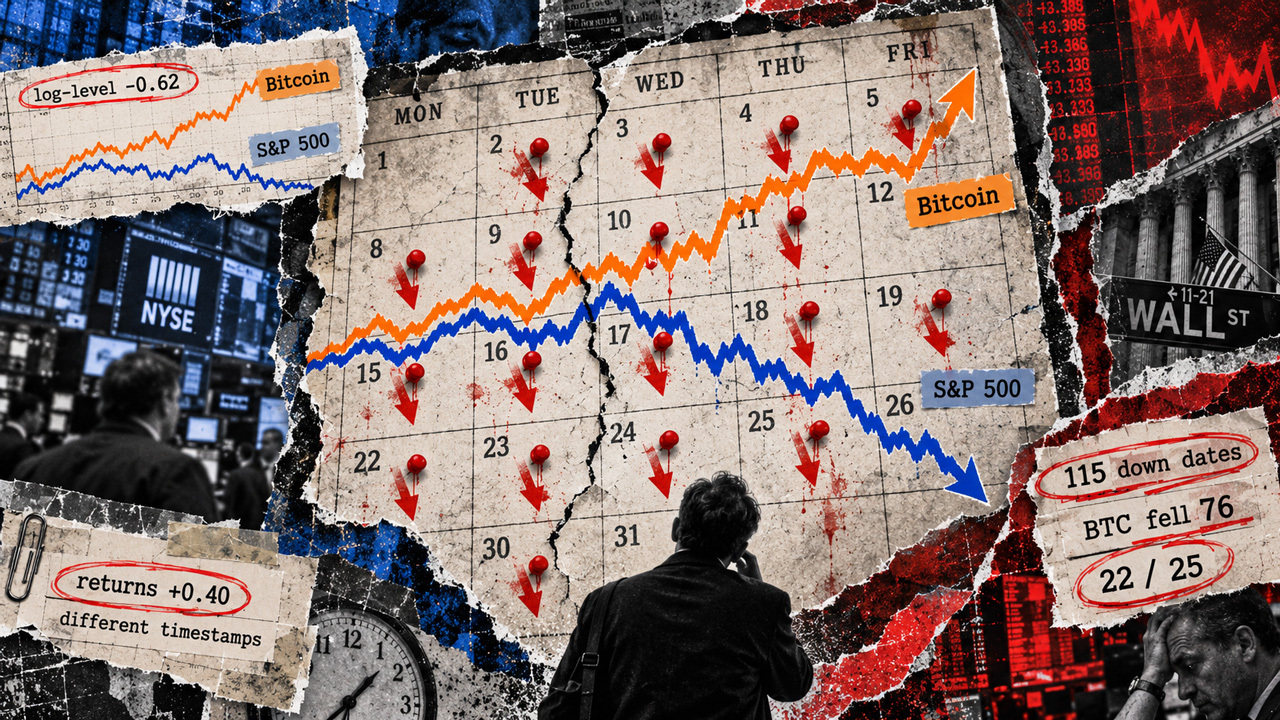
Investors holding Bitcoin alongside US stocks cannot tell whether their portfolio has become safer simply from a negative correlation between the assets’ price paths. A historical comparison through September 4 shows why: Bitcoin and the S&P 500 can move further apart over a year while still posting losses on many of the same trading dates.
Crypto asset manager Bitwise’s September 7 Market Compass described its 260-day correlation as the lowest since 2015. Its chart measures the logarithms of price levels. In CryptoSlate’s calculation using FRED data, that measure was about −0.62. Correlation between percentage returns over 260 common trading observations was +0.40.
The two figures measure different things. The first tracks how the two price paths moved over the period. The second tracks whether their percentage gains and losses tended to move together. Neither shows on its own that Bitcoin will offset losses when stocks fall.
The FRED prices are also recorded at different times of day. The comparison uses available daily observations, not simultaneous closing prices, so it cannot precisely measure how Bitcoin responds to an equity-market shock.
… Continue reading the full article at the original source below.