
Bitcoin Price Analysis: Will BTC Break Above $66K or Fall Below $62K Next?
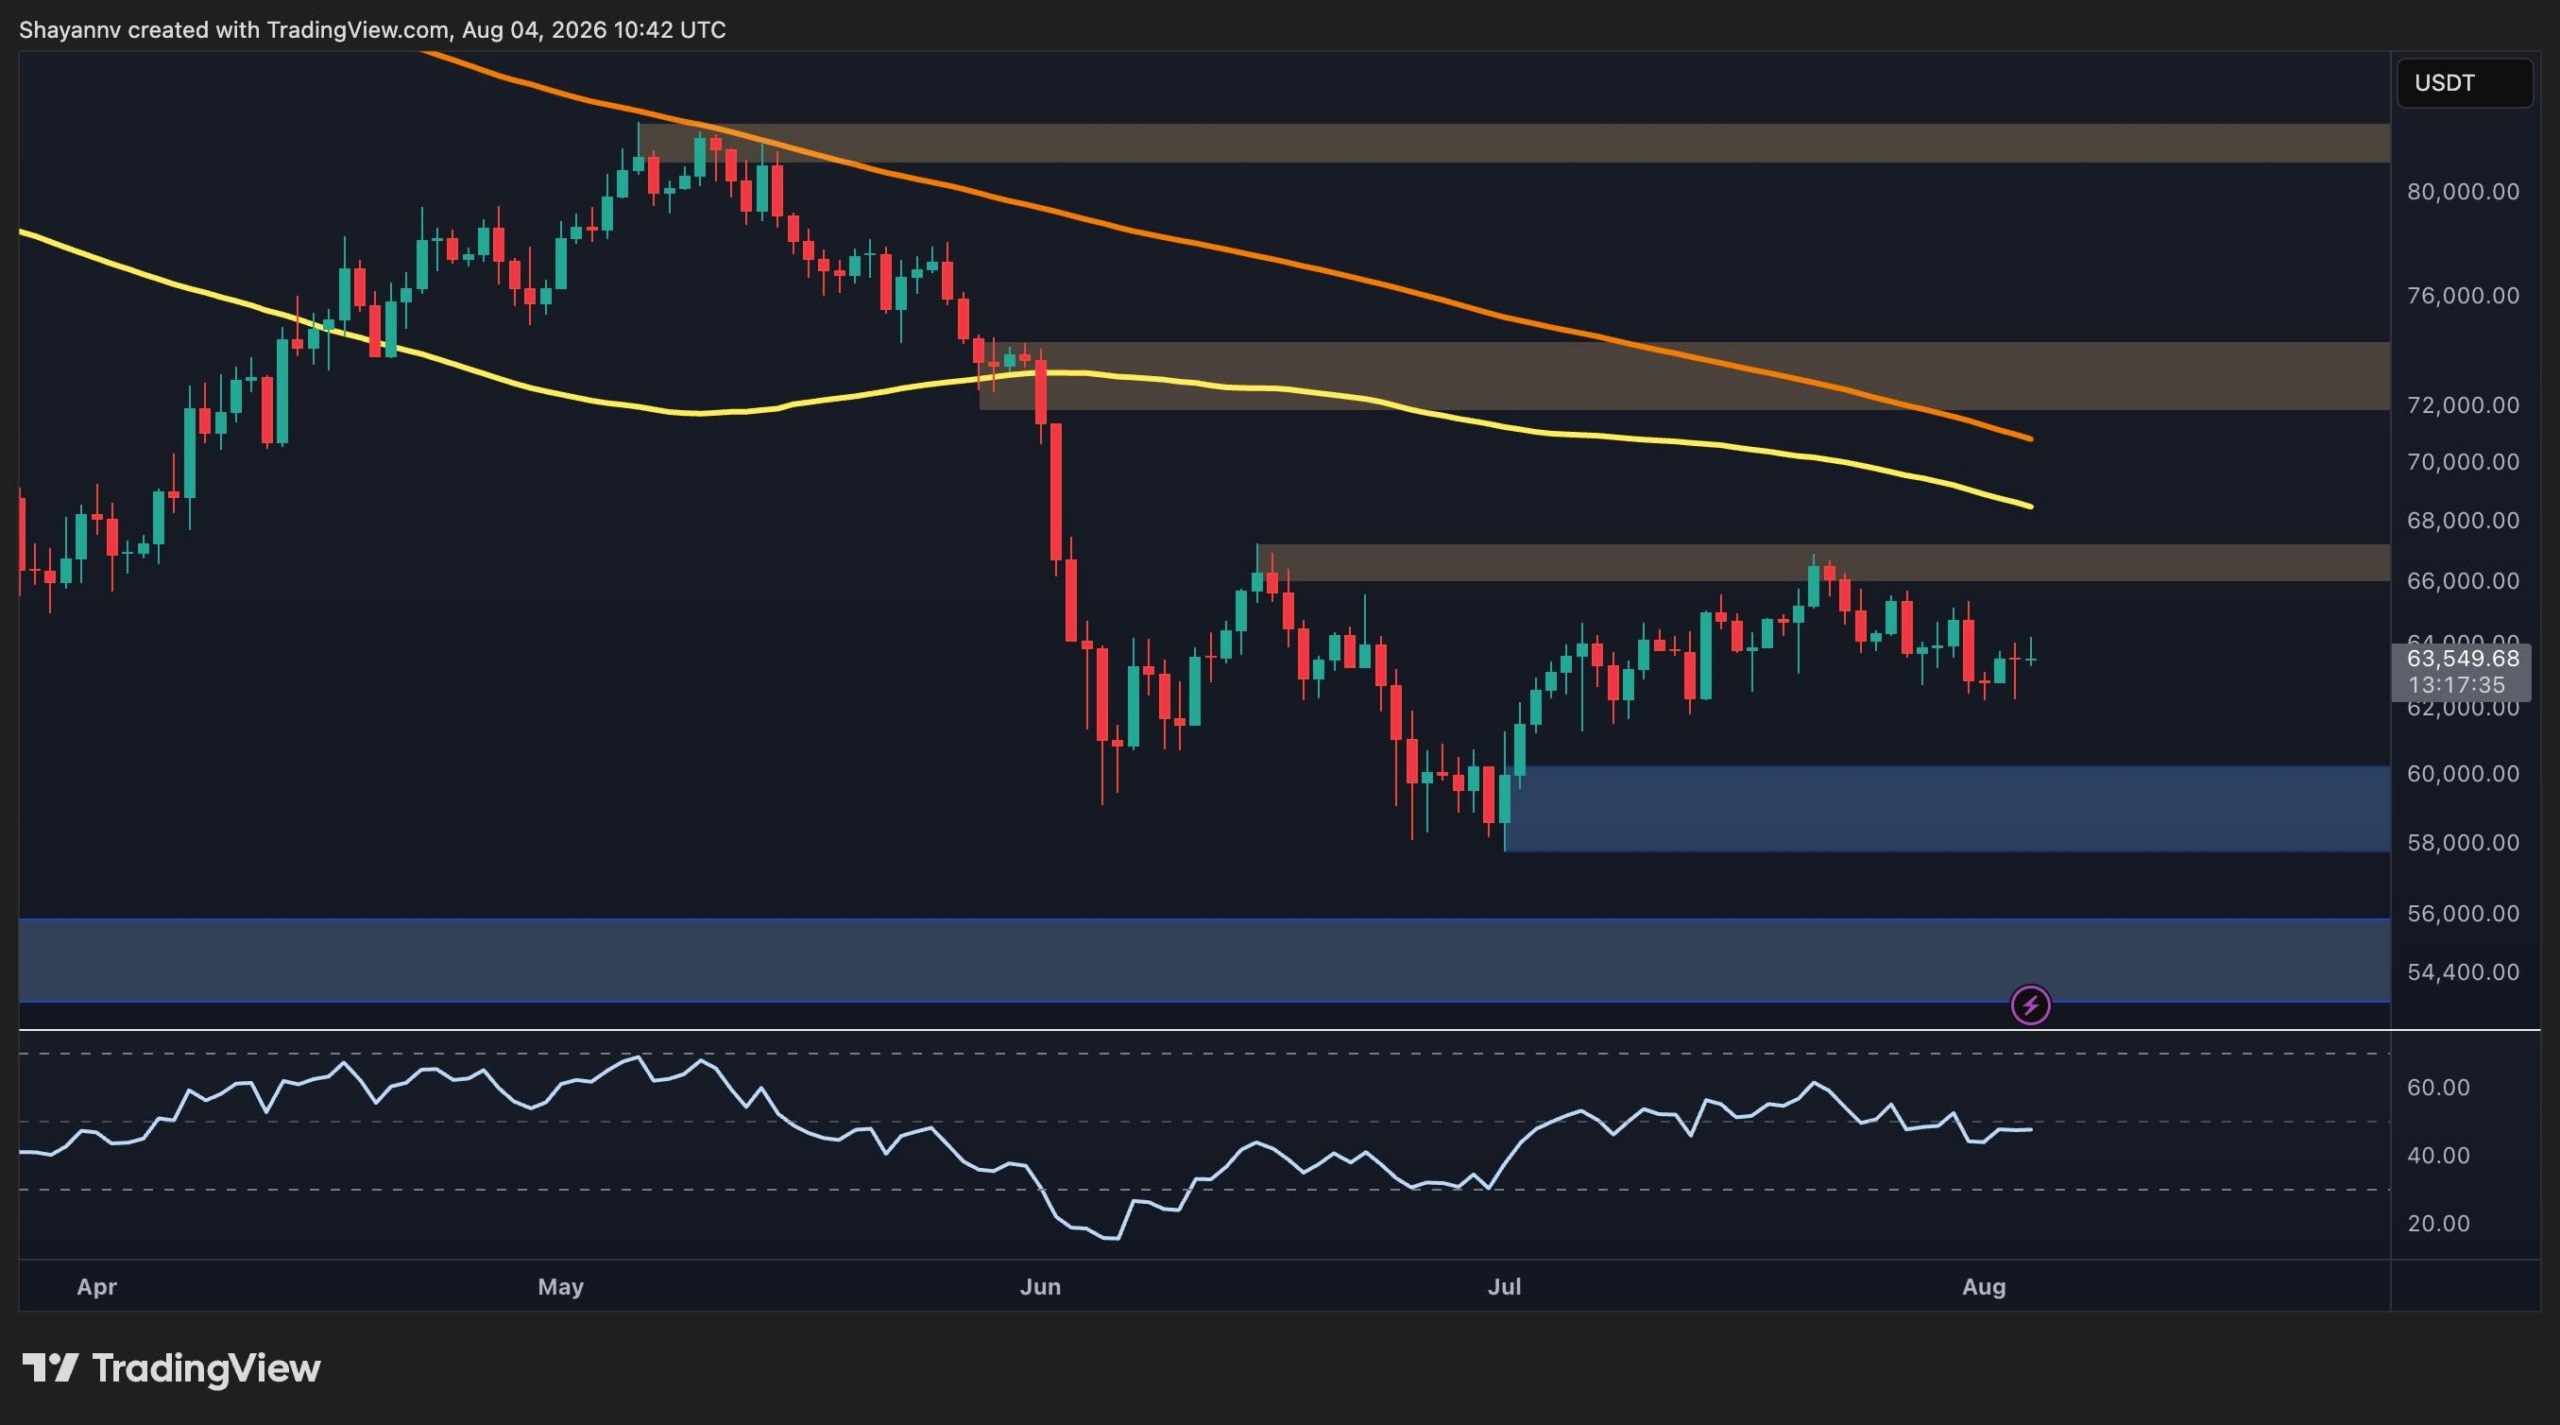
Bitcoin continues to trade within a well-defined consolidation range after failing to establish a meaningful recovery from its late June lows. While short-term price action has stabilized above key support, the broader structure remains neutral to bearish, with overhead resistance still capping every rally. At the same time, the Coinbase Premium Index remains in negative territory, suggesting that US spot demand has yet to return in a convincing manner.
Bitcoin Price Analysis: The Daily Chart
On the daily timeframe, BTC continues to trade around $63.5K after spending several weeks ranging beneath the $67K resistance zone. This area has repeatedly rejected bullish advances and now represents the first major hurdle for buyers.
The broader trend remains bearish as the price continues to trade below both the 100-day and 200-day moving averages, which are sloping downward around the $68K and $70K regions, respectively. These moving averages reinforce the bearish higher-timeframe structure and create a strong confluence resistance zone above the market.
… Continue reading the full article at the original source below.
