
Bitcoin Price Analysis: Bearish Sentiment Persists but BTC’s Next Move Hinges on the Fed
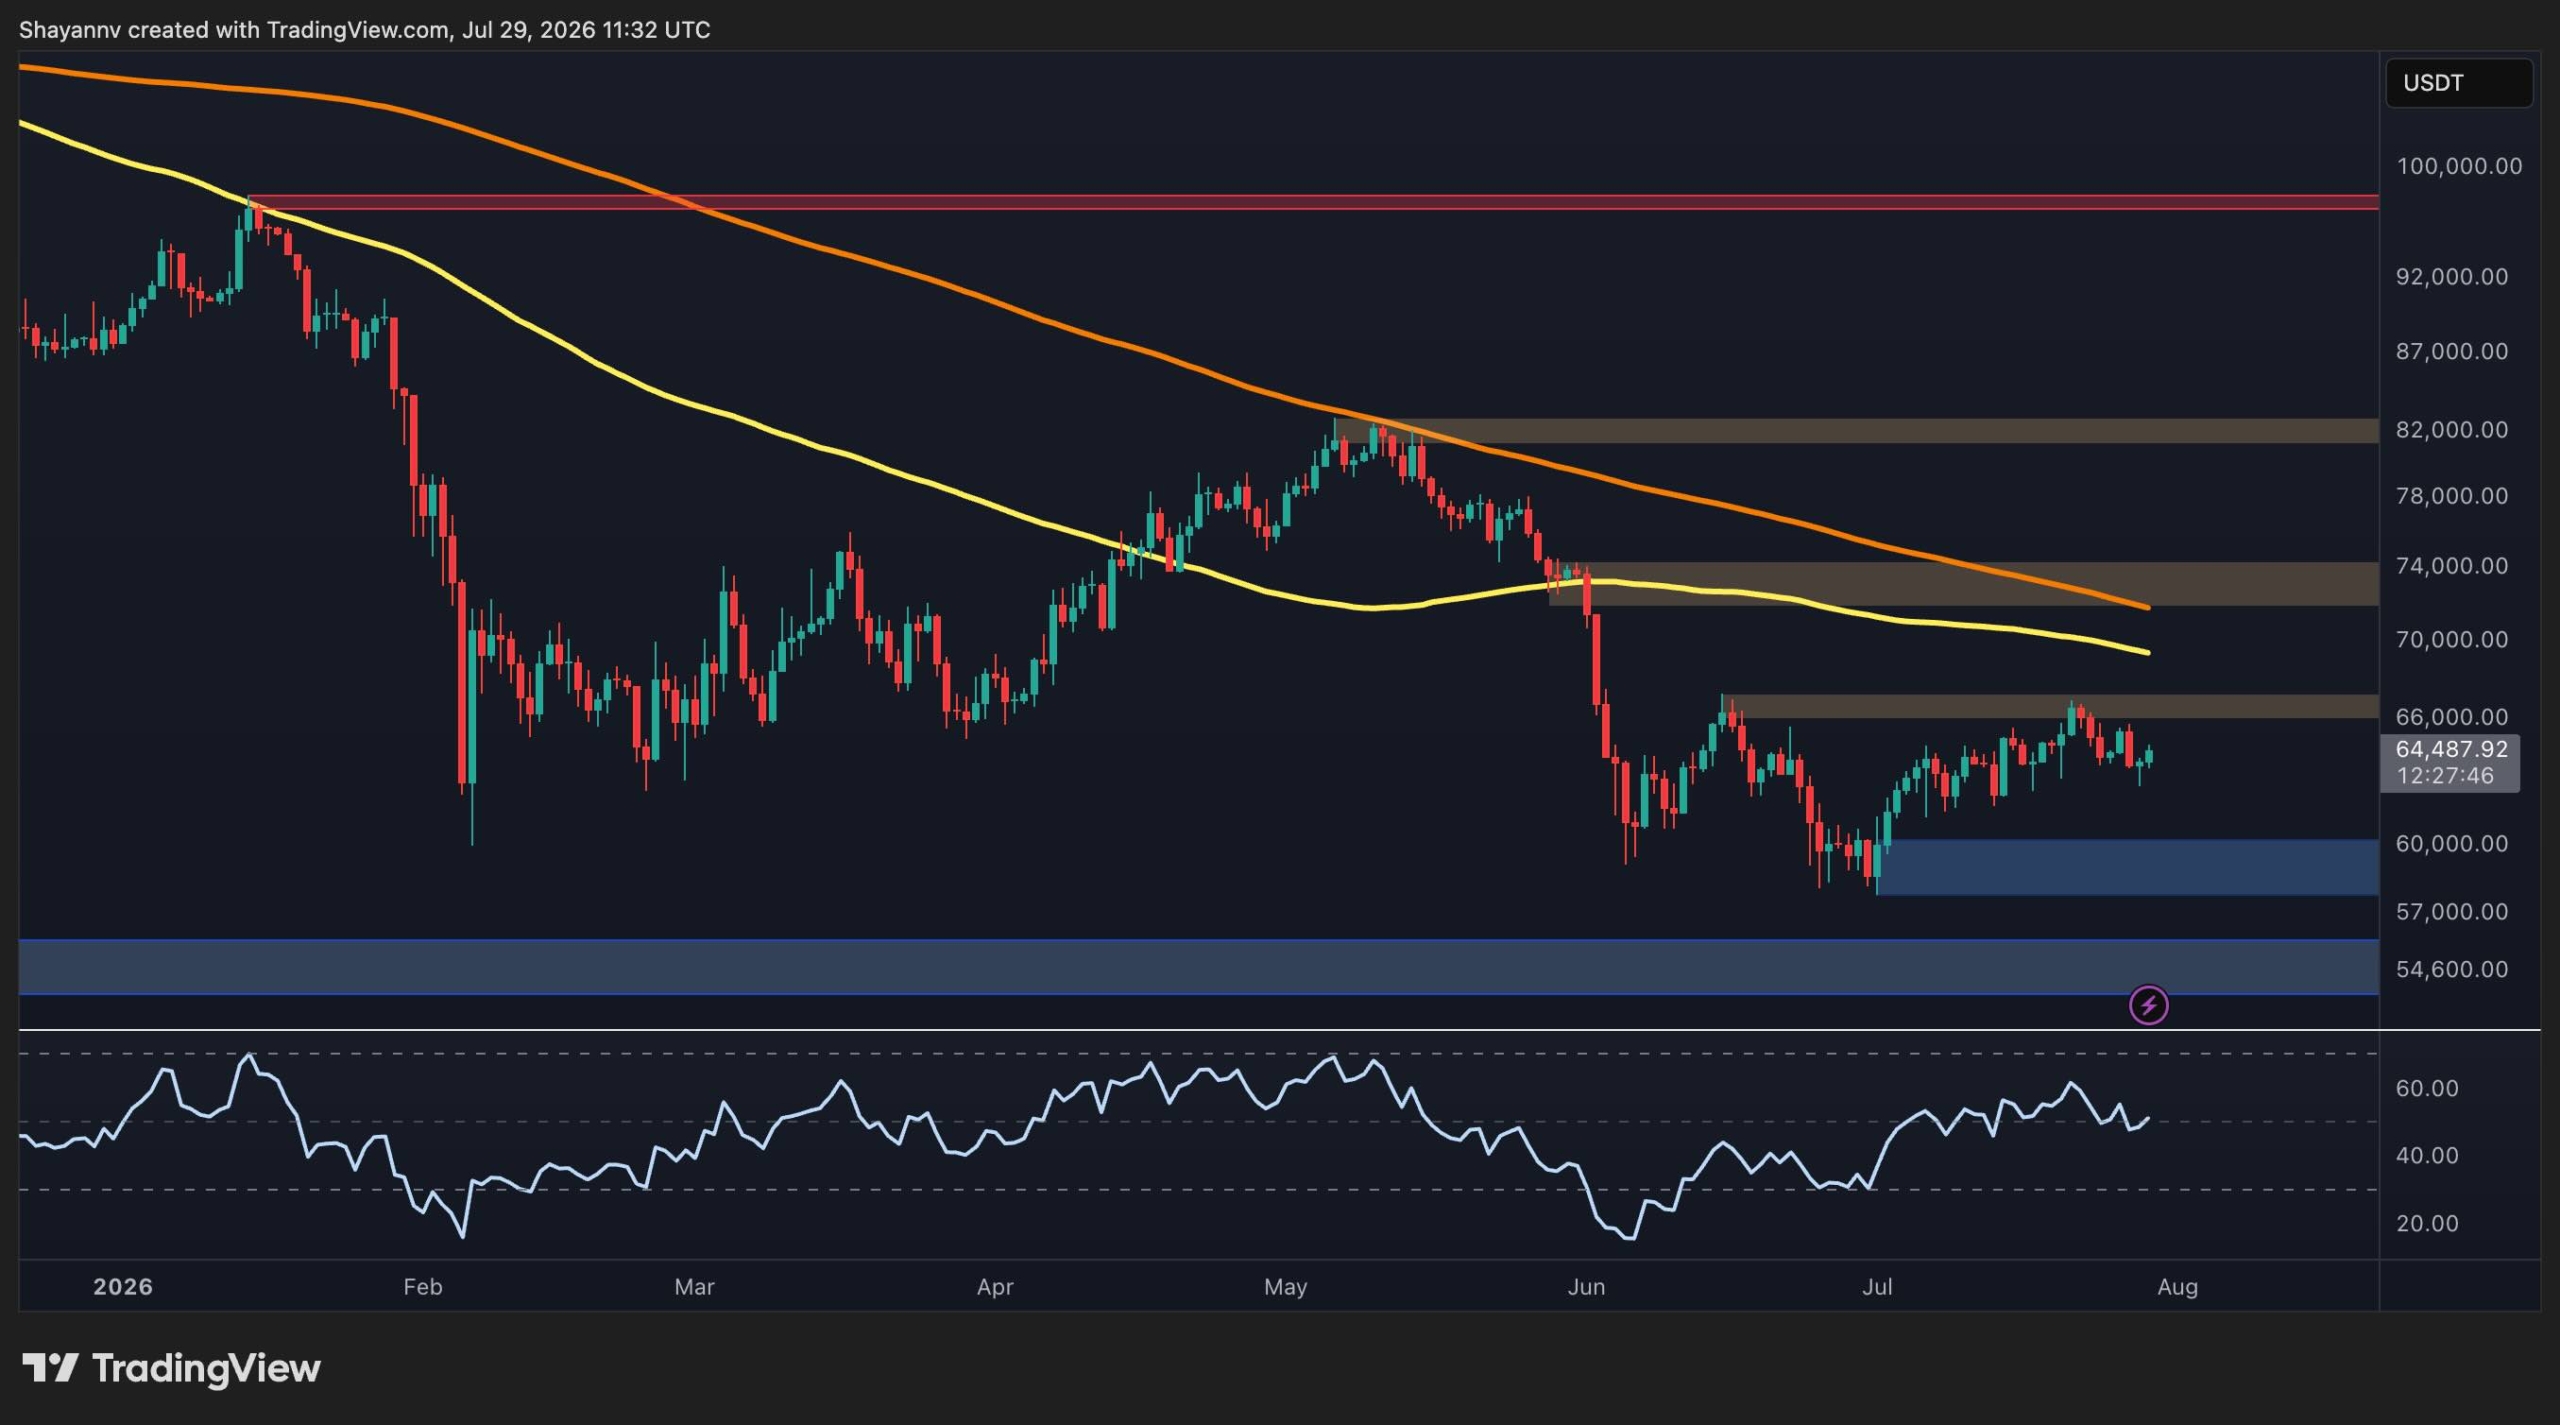
Bitcoin remains trapped below key higher-timeframe resistance despite managing to stabilize above an important support region. While the broader trend is still bearish, the latest recovery attempt is accompanied by a notable uptick in the Exchange Whale Ratio, suggesting larger players are becoming increasingly active.
Bitcoin Price Analysis: The Daily Chart
On the daily timeframe, BTC continues to trade below both the 100-day and 200-day moving averages, which are positioned around the $68K and $72K regions, respectively. The bearish alignment of these moving averages confirms that sellers still control the broader trend.
Following the sharp breakdown in early June, Bitcoin has entered a prolonged consolidation phase between the $58K support area and the $66K resistance zone. The price is currently hovering around $64K after several failed attempts to reclaim the overhead supply near $66K.
The $66K level represents the first major resistance, while a stronger barrier lies around $74K, just above the 100-day and 200-day moving averages. A sustained breakout above these levels would improve the medium-term outlook and could expose the $82K resistance area.
… Continue reading the full article at the original source below.
