
Bitcoin Price Analysis: Is $60K Back in Play After BTC’s Latest Rejection?
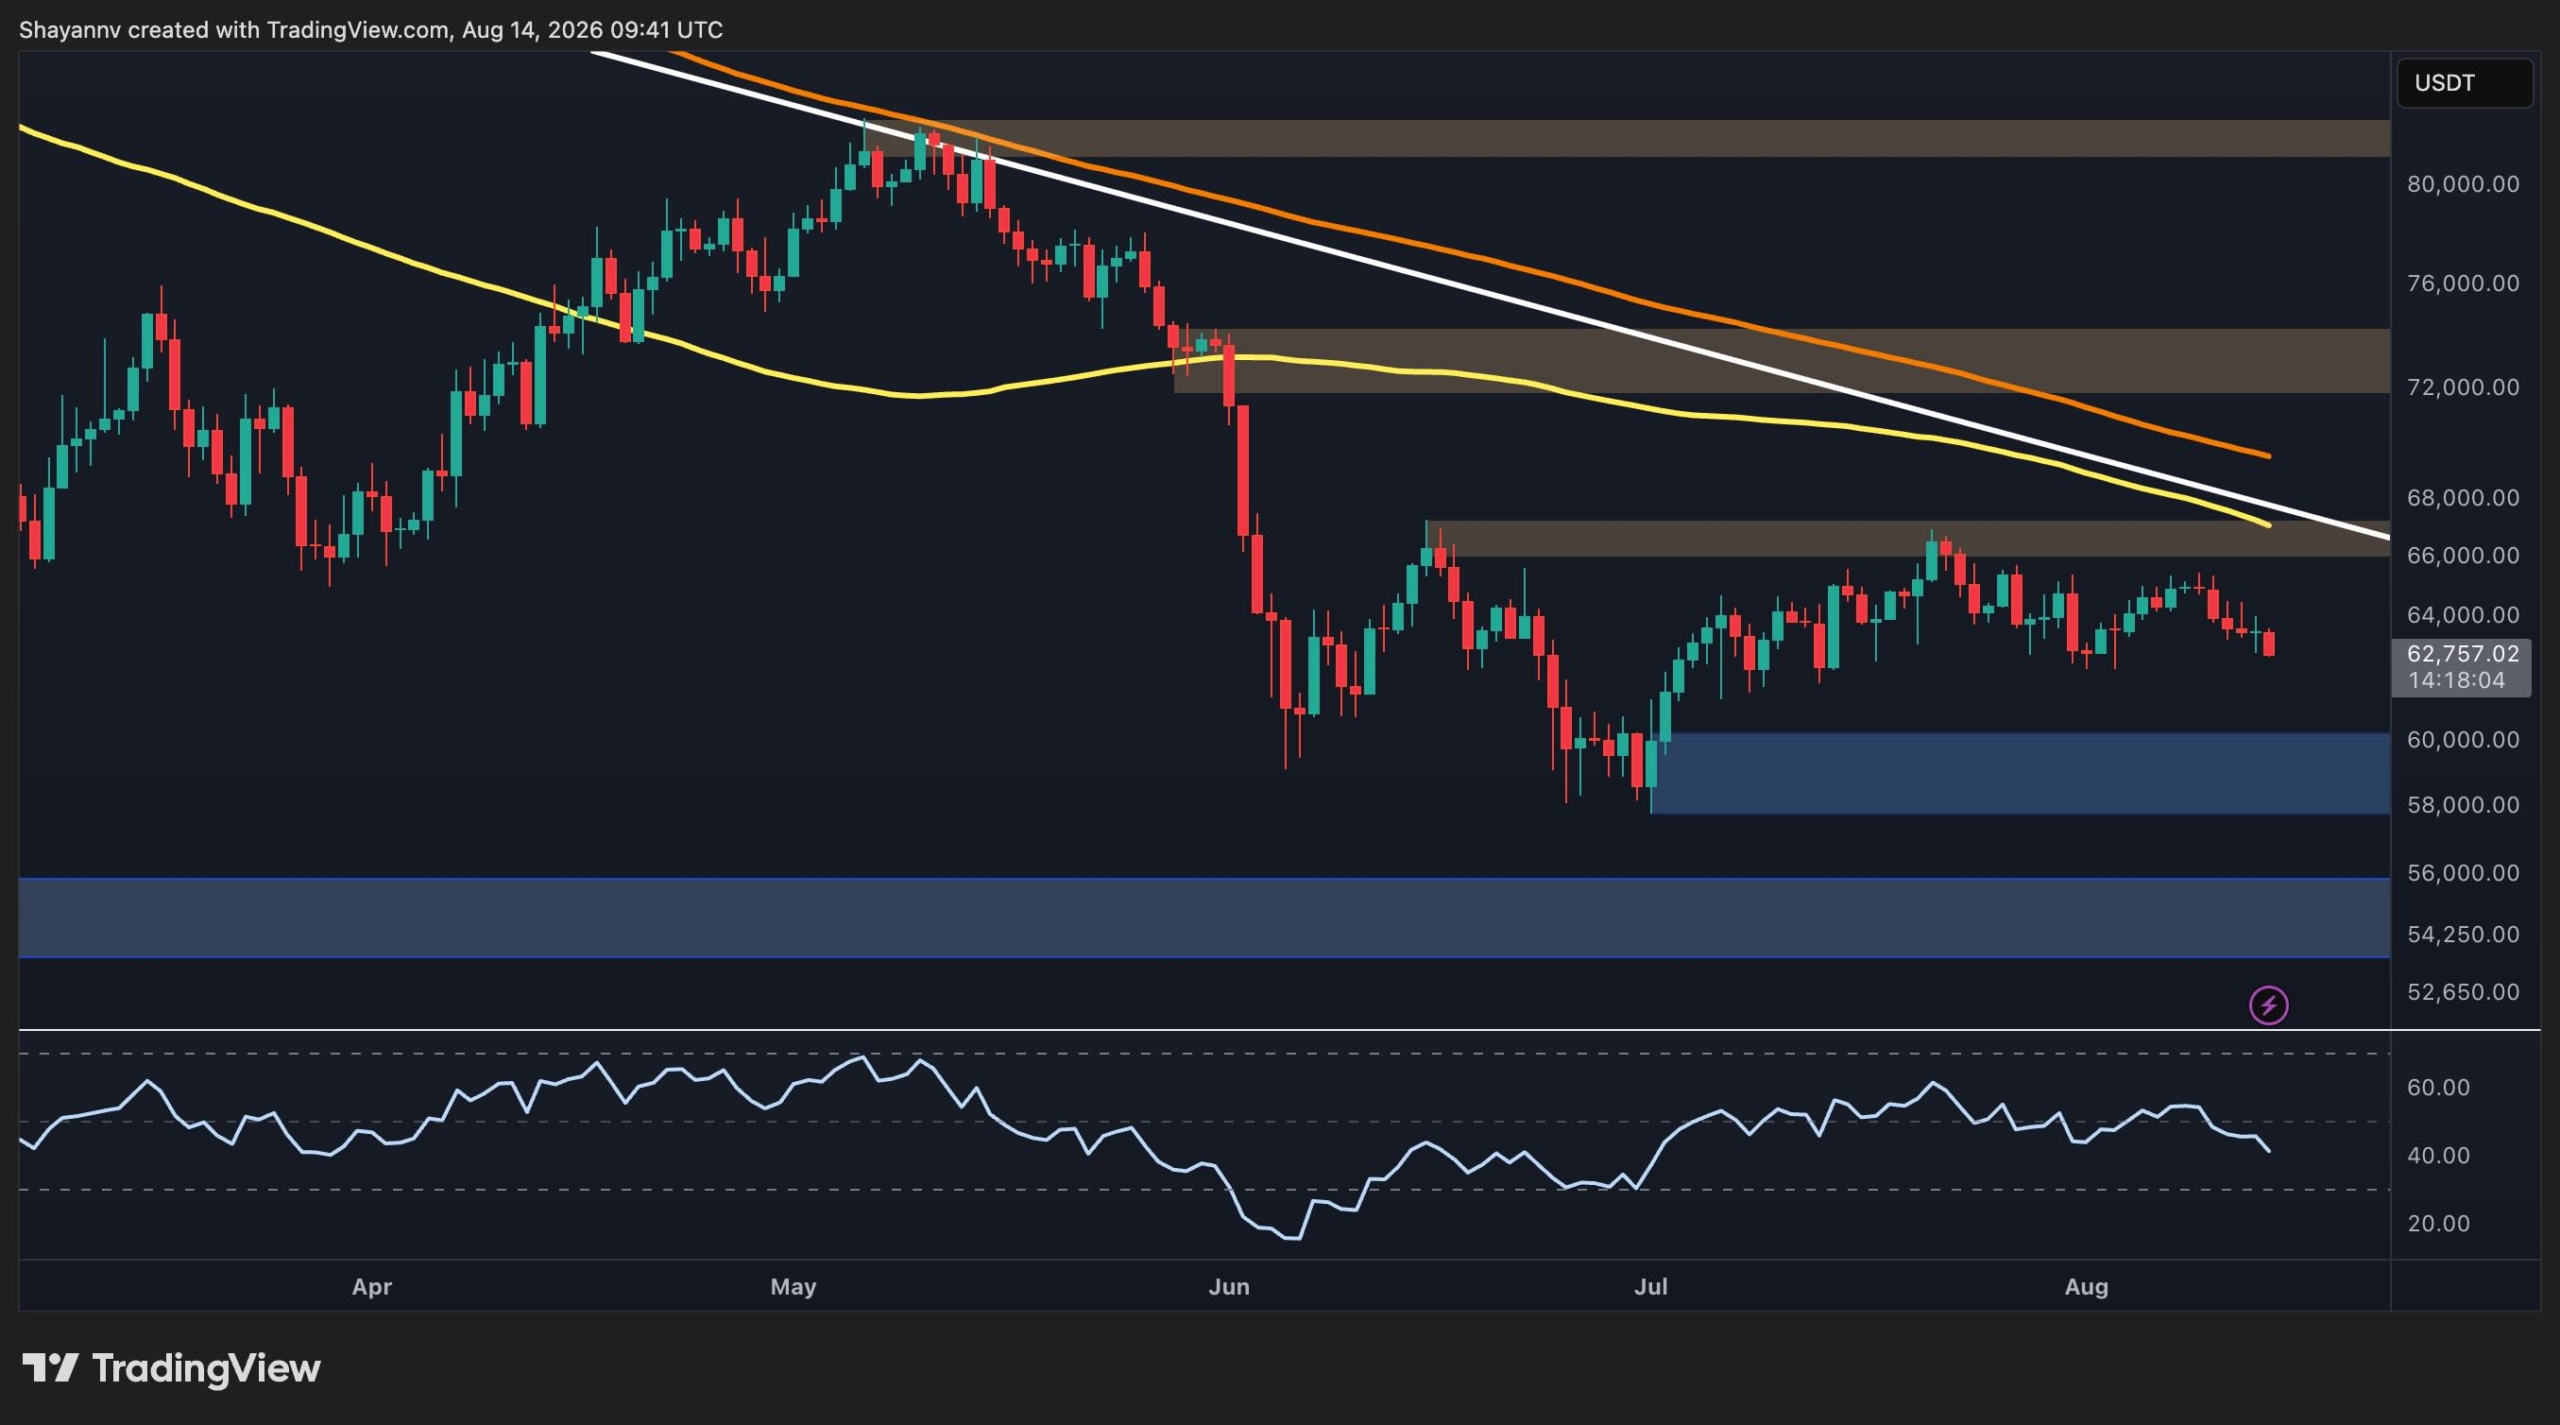
Bitcoin is testing a critical support area after failing to break above the descending resistance structure that has capped the price for months. With BTC trading around $62.7K, the market is approaching a key decision point, while the elevated Exchange Whale Ratio adds a potentially bearish on-chain signal to the technical picture.
Bitcoin Price Analysis: The Daily Chart
The daily chart shows that Bitcoin remains within a broader corrective structure. After recovering from the June low near $58K, BTC established a series of higher lows and climbed toward the $66K resistance zone. However, the recovery has so far failed to produce a decisive breakout, and price has recently turned lower.
The most important resistance is currently around $66K-$67K, where the descending trendline, the horizontal supply zone, and the broader moving-average structure converge. A daily close above this area would represent a meaningful improvement in market structure and could open the way toward the $72K-$74K zone. Beyond that, the $80K-$82K region remains a major higher-timeframe resistance area.
… Continue reading the full article at the original source below.


