Bitcoin Price Analysis: What Does BTC’s Bearish Market Structure Signal Next?
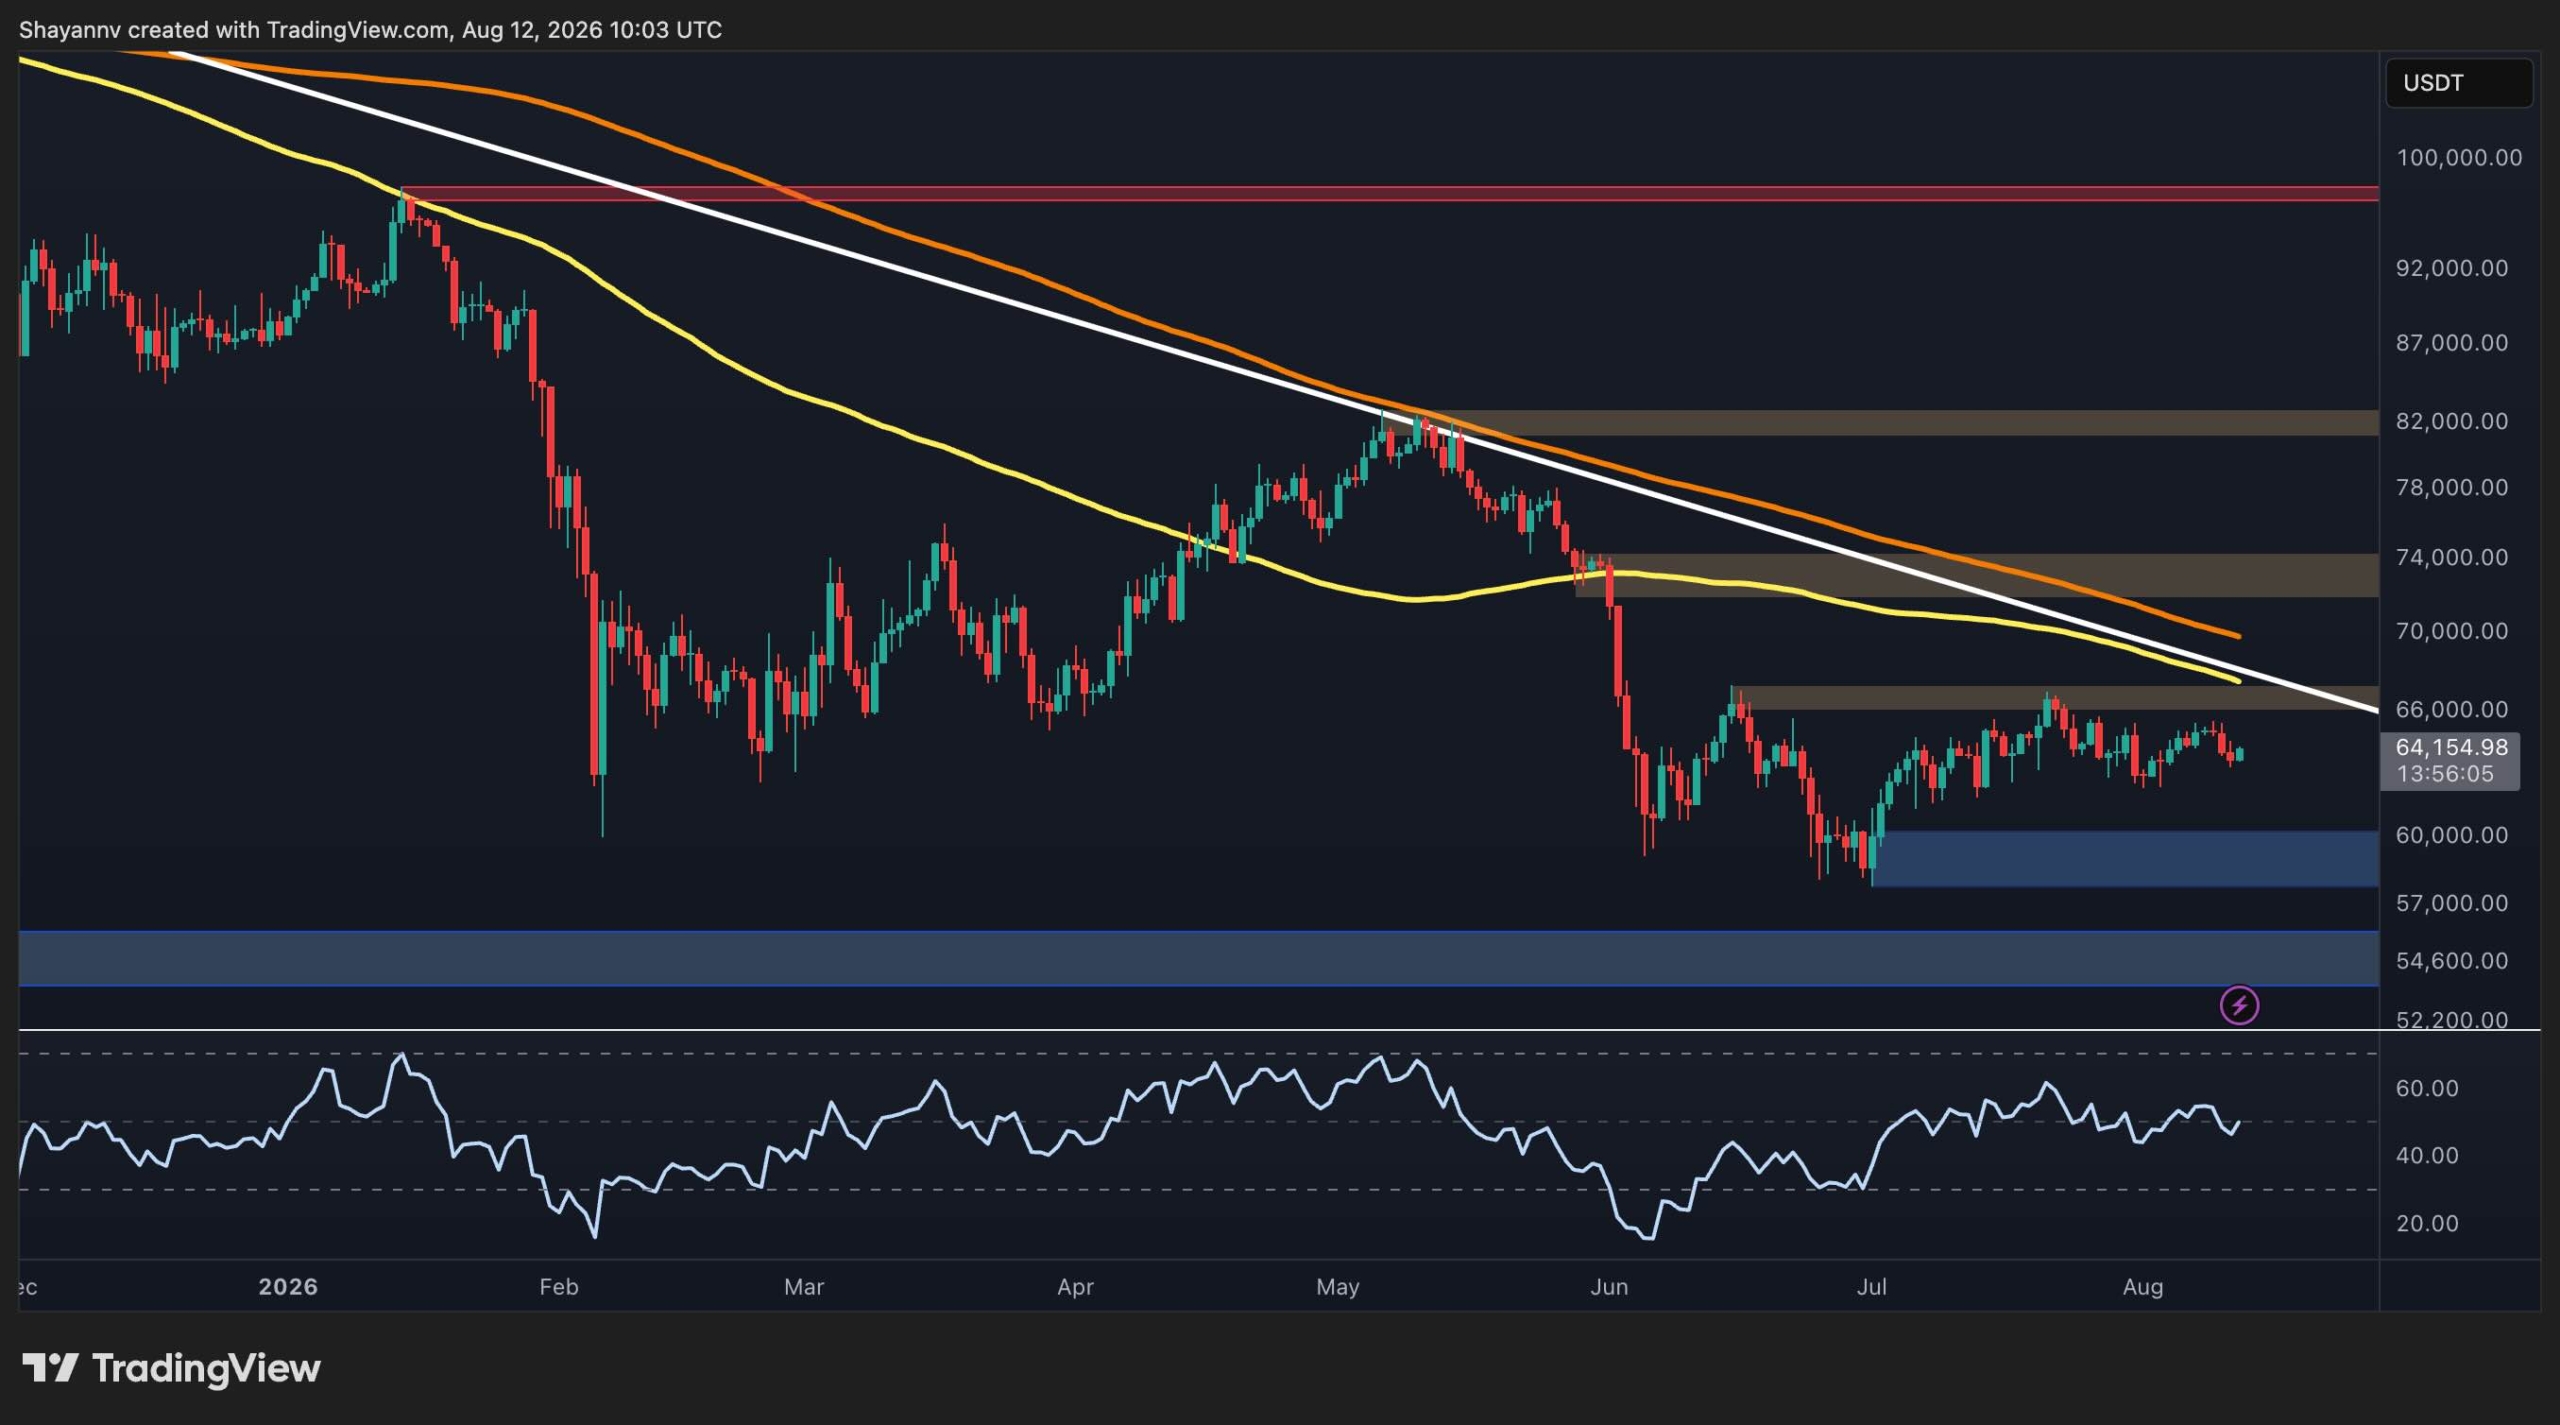
Bitcoin remains trapped in a broad consolidation phase, with the price struggling to break above the descending resistance that has governed the market for several months. At around $63.5K, BTC is showing some short-term recovery, but the broader structure remains cautious until the key resistance zones are decisively broken.
Bitcoin Price Analysis: The Daily Chart
The daily chart shows Bitcoin trading below a descending trendline that connects the major highs since the beginning of the year. The trendline currently sits around the $66K area, making this the first major hurdle for the buyers. A daily breakout above this resistance would represent an important structural improvement and could open the door toward the $74K resistance zone.
The broader trend remains bearish-to-neutral; however, BTC is still trading below the major moving averages displayed on the chart. The longer-term moving averages are sloping downward, reinforcing the significance of the descending trendline.
On the downside, the $60K area represents an important support zone, while the broader $54K region is the next major demand area visible on the chart. Holding above these levels keeps the current consolidation structure intact, whereas a sustained breakdown could signal another leg lower.
… Continue reading the full article at the original source below.