Bitcoin Price Analysis: BTC’s Rally Means Nothing Until It Reclaims This Key Level
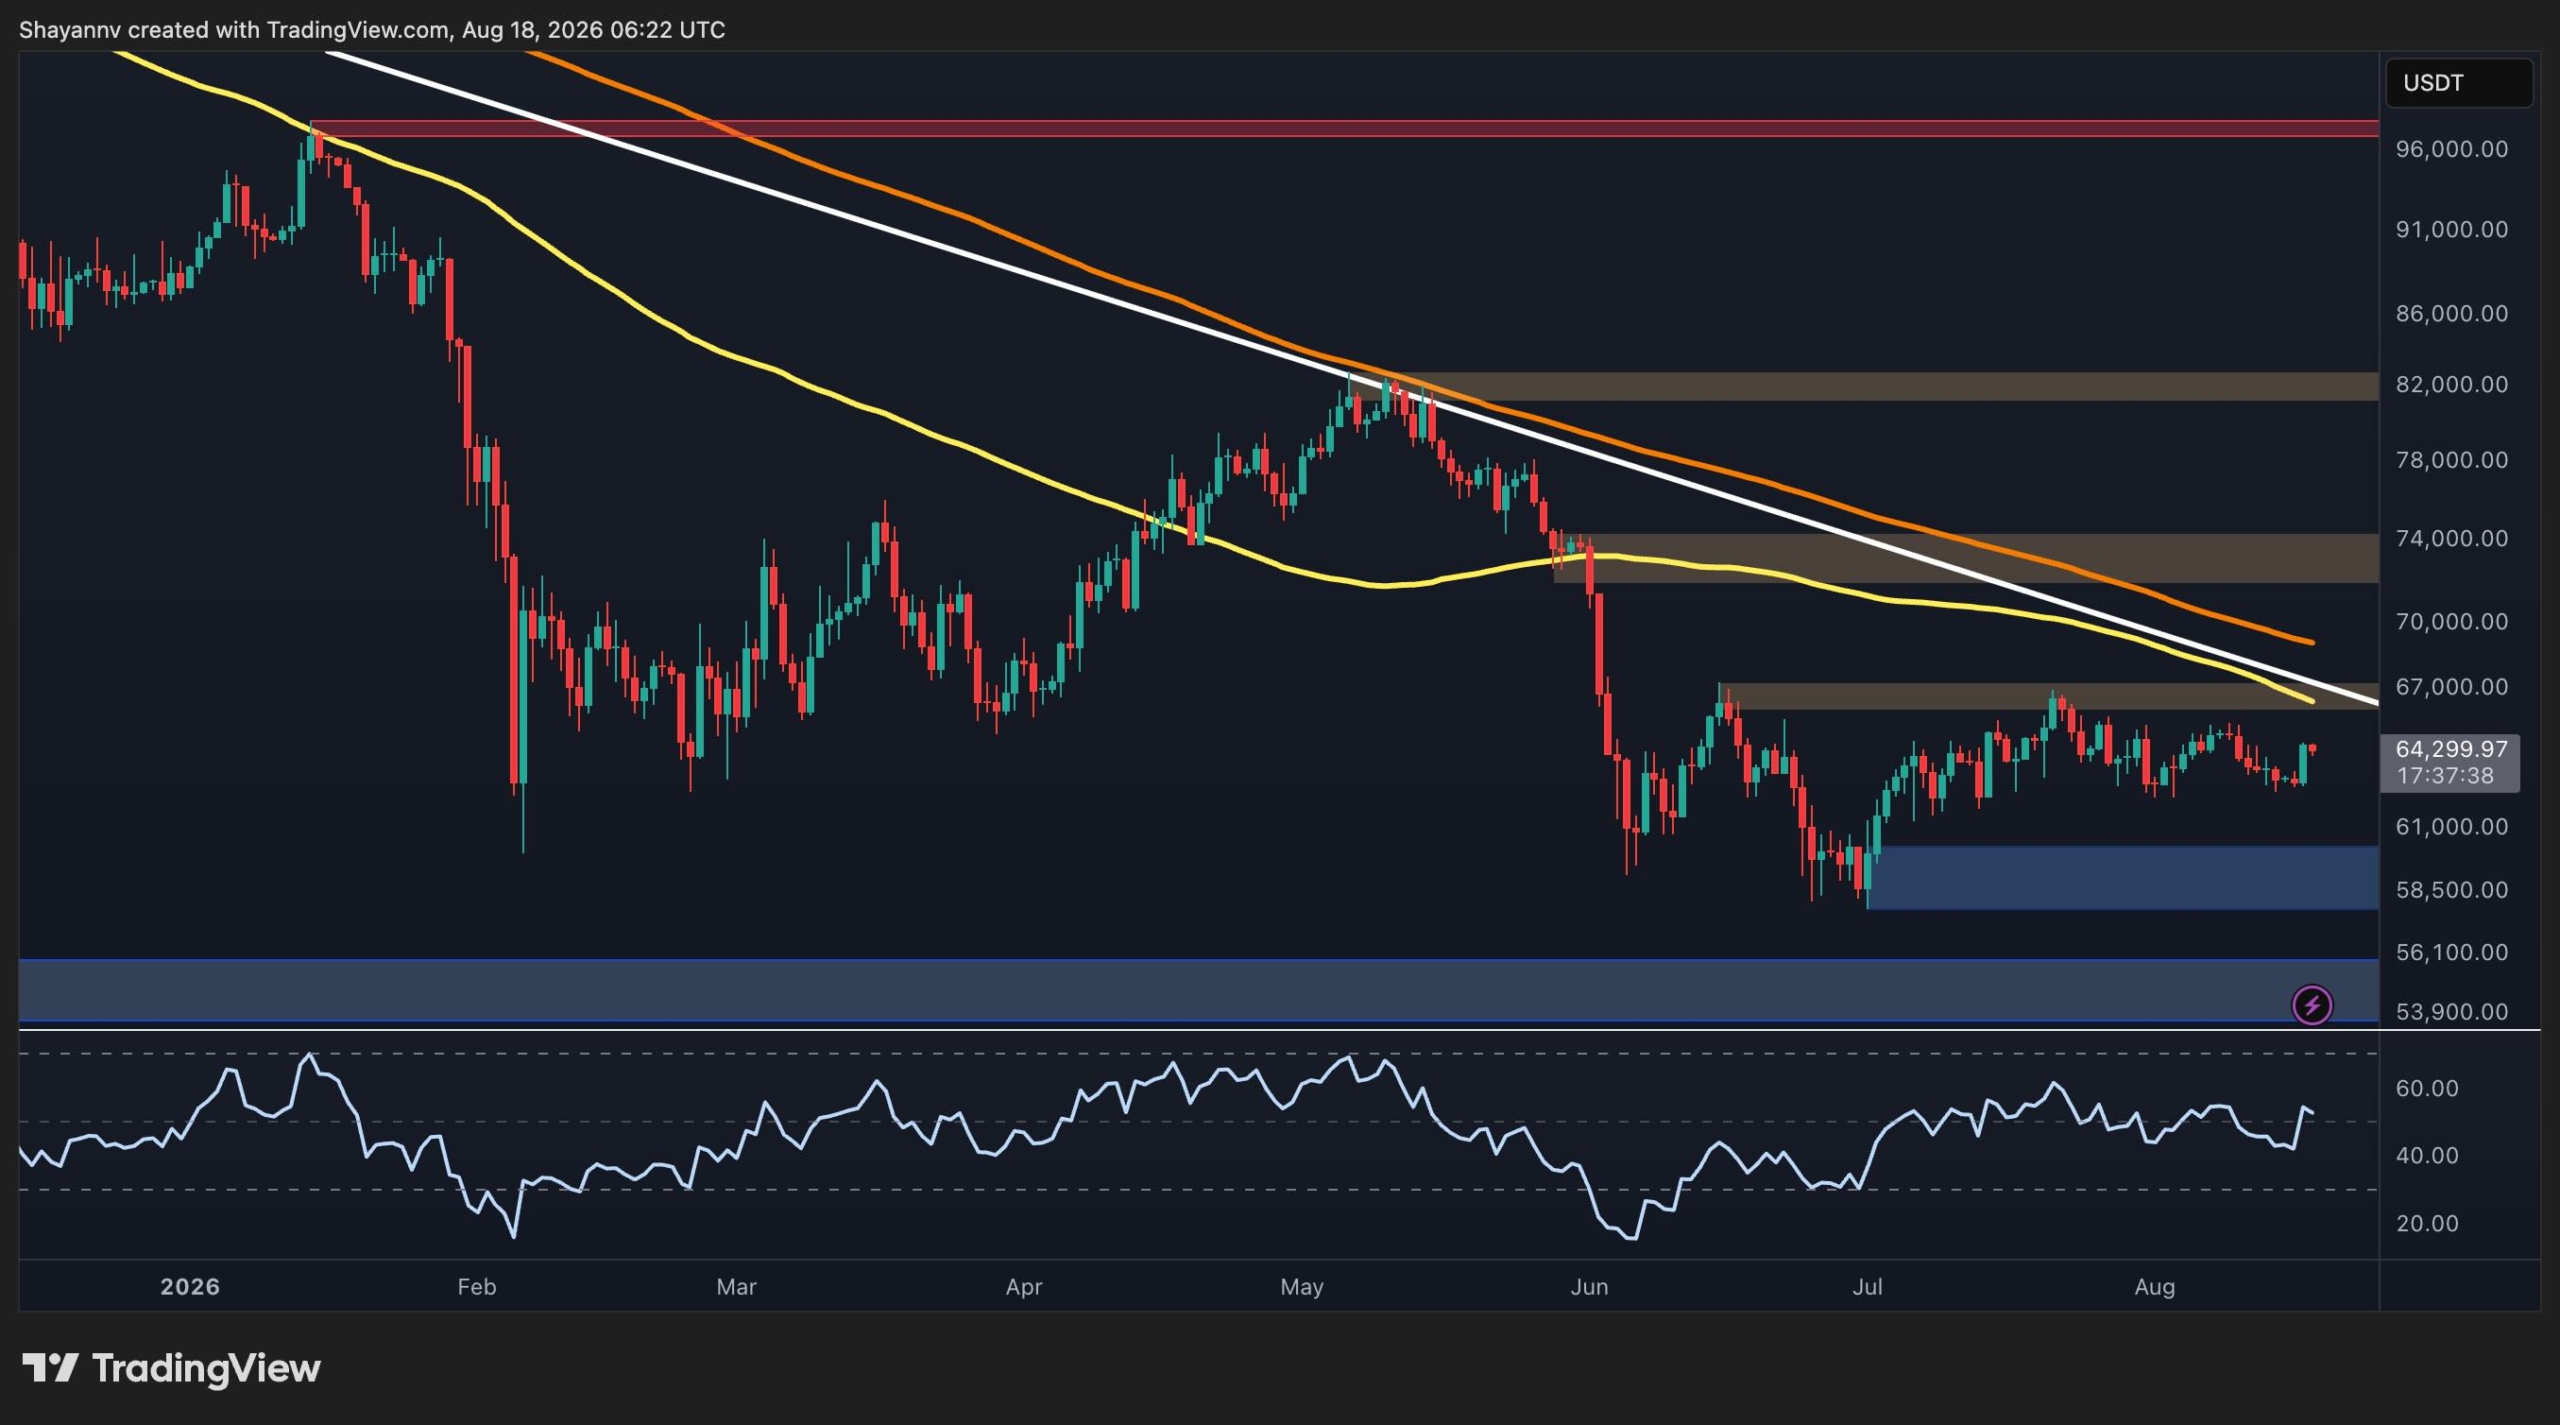
Bitcoin remains trapped in a broad corrective structure, with the price currently near $64.3K after failing to reclaim several important resistance levels. The daily chart shows a persistent bearish trendline and weakening momentum, while the 4-hour structure suggests that the asset is compressing inside a narrowing range. Meanwhile, NUPL has fallen sharply from cycle-high territory, indicating that aggregate unrealized profits have been significantly reduced.
Bitcoin Price Analysis: The Daily Chart
Bitcoin’s daily chart remains technically cautious. The price is trading below the descending white trendline and the 100-day and 200-day moving averages. This alignment keeps the broader trend tilted to the downside until BTC can reclaim these dynamic resistance levels.
The most immediate horizontal resistance sits around the $67K zone, where the descending trendline and a horizontal supply area converge. A daily breakout above this region would be an important improvement in market structure and could open the way toward the $72K-$74K resistance zone. Above that, the $82K area represents another major supply region.
… Continue reading the full article at the original source below.