
Ethereum (ETH) Price: Bullish Signals Are Stacking Up - Can ETH Finally Break $2,000?
TLDR
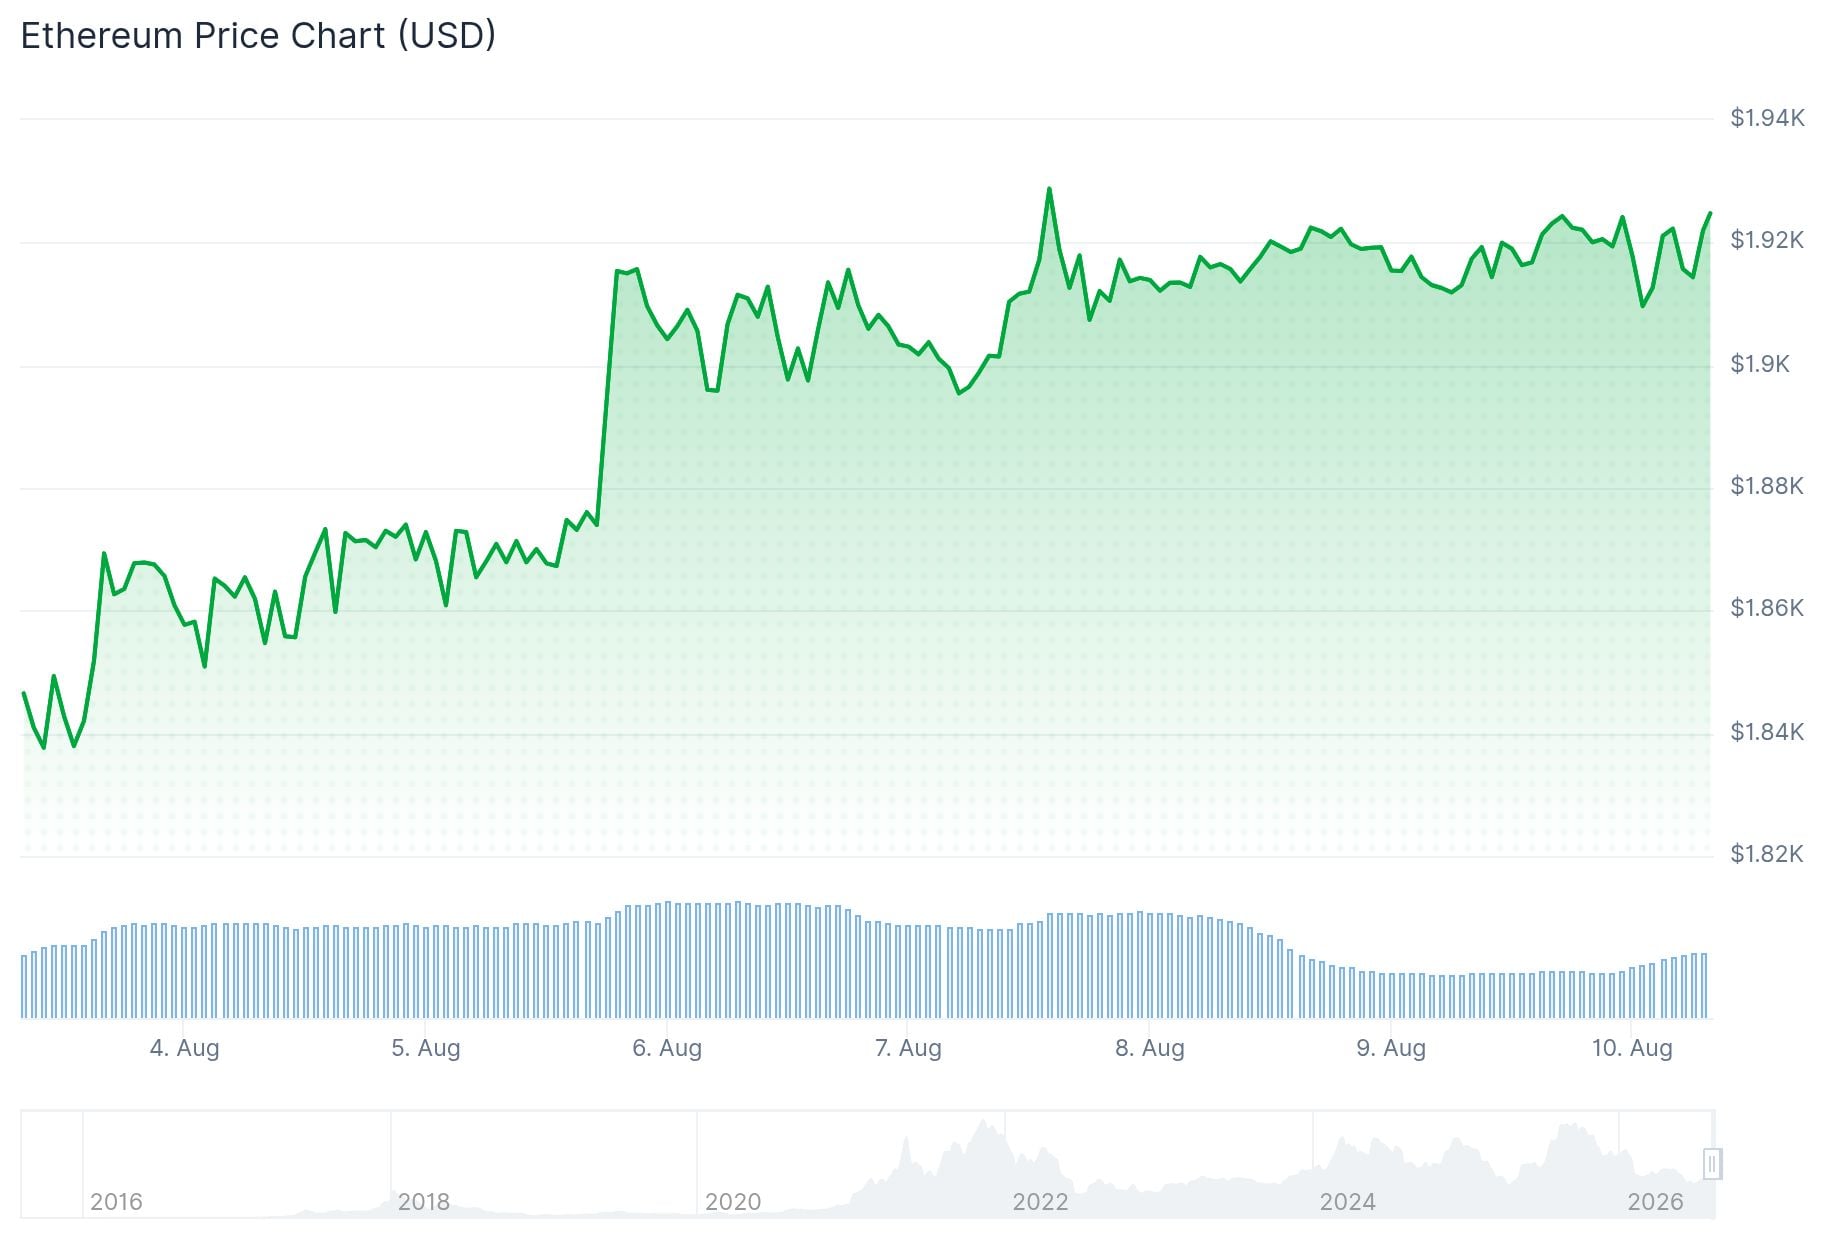
- ETH is trading at $1,920.43 with a market cap of $231.76 billion
- Two monthly TD Sequential Buy signals (Black 9 and S13) have appeared on the chart
- The $1,800–$1,850 demand zone has held during recent dips
- Key resistance sits between $1,980 and $2,000, with $2,100 as the next upside target
- Spot Ethereum ETFs saw $244.94 million in net inflows last week, the highest in four months
Ethereum is trading around $1,920.43, holding above a key demand zone as technical signals on its monthly chart point to a possible trend reversal.
The 24-hour trading volume stands at $6.78 billion. Ethereum’s market cap is approximately $231.76 billion, making up roughly 10.49% of the total crypto market.
Two monthly TD Sequential Buy signals have appeared on ETH’s chart: a Black 9 and an S13. These signal types have appeared before at major turning points in Ethereum’s price history.
Analyst Ali Charts pointed to past examples. A Black 9 buy signal in September 2022 was followed by a 236% rally. An A13 buy signal in April 2025 led to a 258% gain. Past performance does not guarantee future results, but the signals are being watched closely.
… Continue reading the full article at the original source below.

