Solana (SOL) Price: 10 Red Monthly Candles in a Row - Is $60 Next?
TLDR
- SOL has dropped 10% in the past 30 days after breaking a key trend line support
- Solana ETFs saw only $14.6 million net inflows in July and a net outflow in June
- A crossover in daily active user moving averages signals a potential sharp price decline
- SOL trades below its 100-day SMA ($78.06) and 200-day SMA ($84.71)
- Key support levels to watch are $72, $70, and the $66–$67 zone
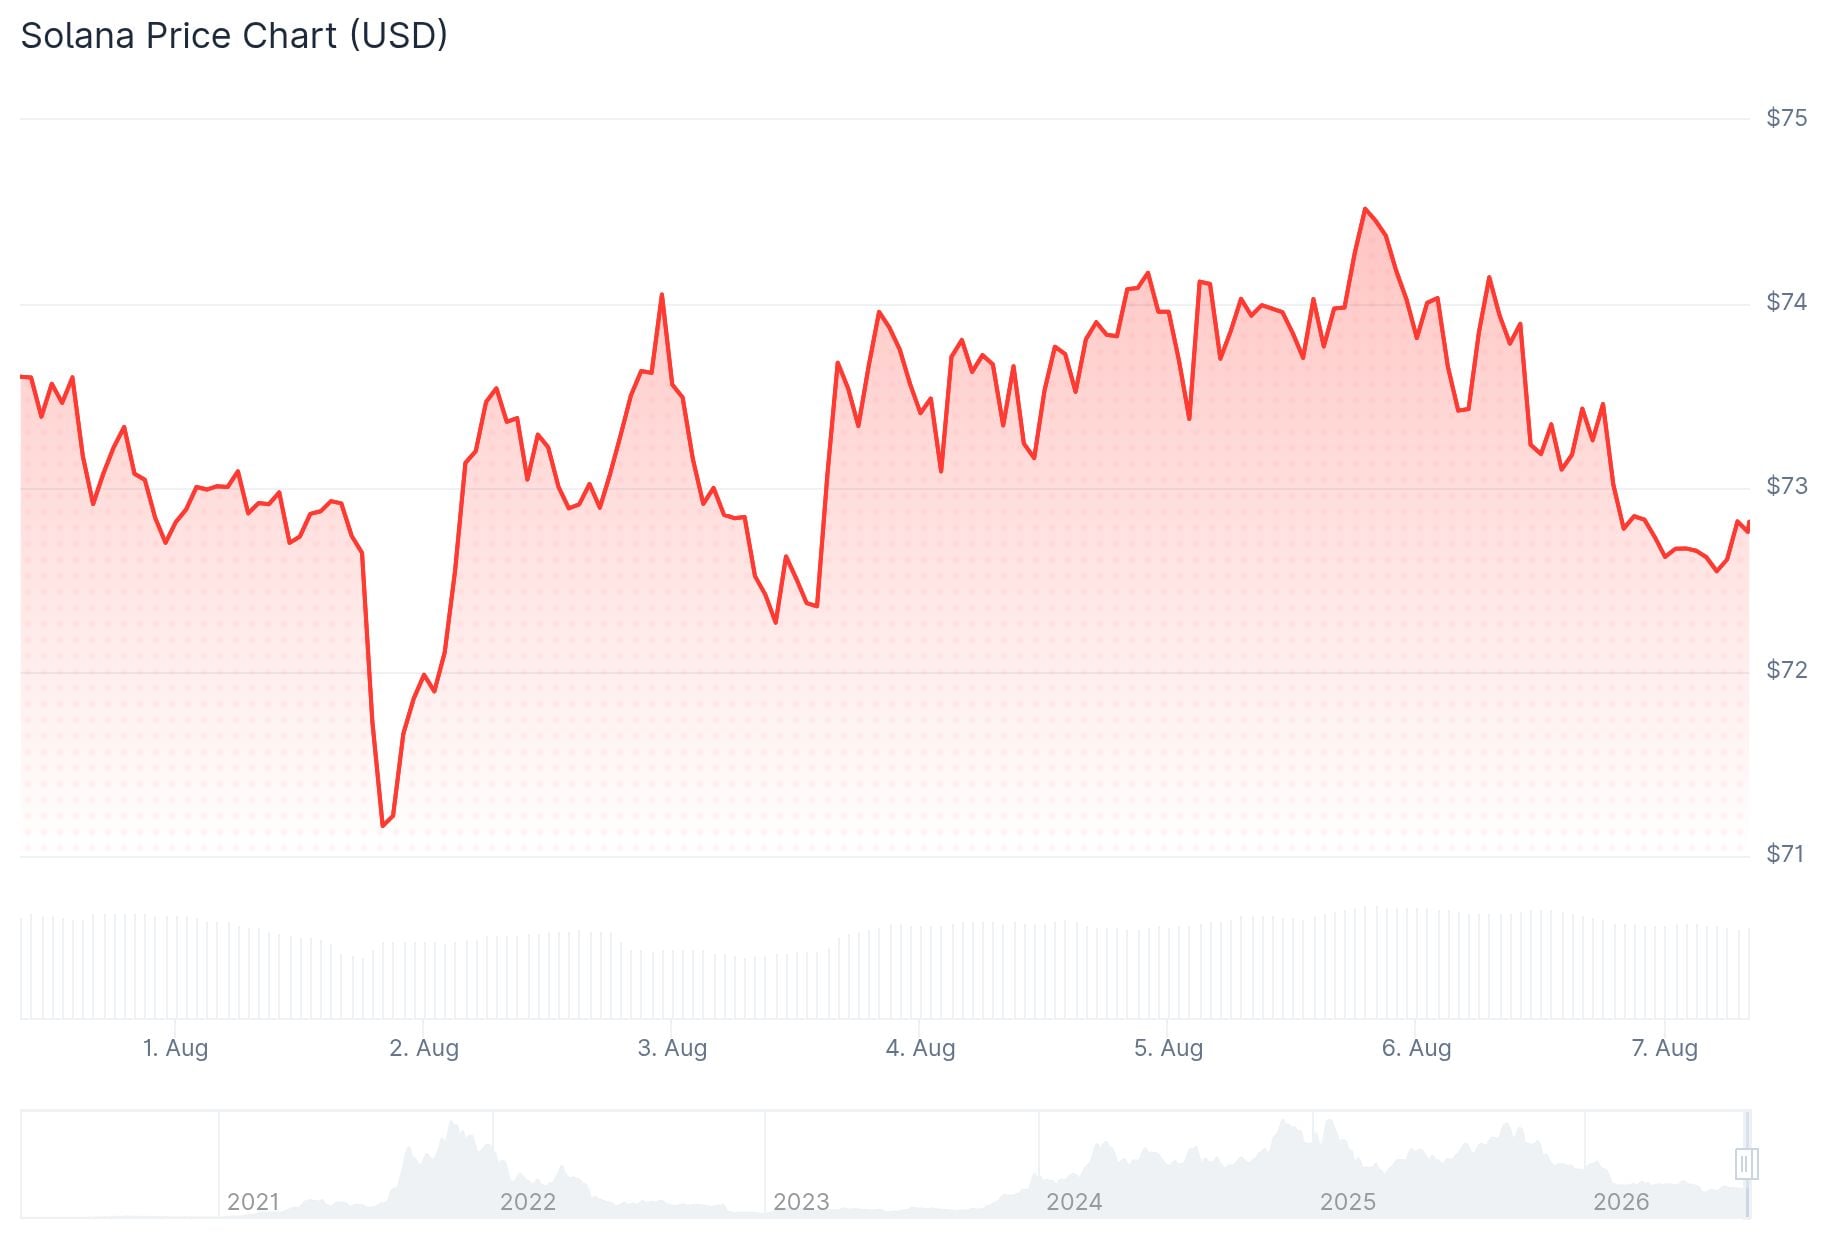
Solana (SOL) is trading around $73 after falling 10% over the past 30 days. The price broke below a key trend line and has since formed a bearish descending channel on the daily chart.
The token is now below both its 100-day simple moving average of $78.06 and its 200-day SMA of $84.71. That keeps the broader technical structure under pressure for now.
Sellers have been in control for several weeks. SOL has been making lower highs since failing to reclaim the July peak near $82. The stochastic oscillator has fallen to 3.06, deep in oversold territory, while the Ultimate Oscillator sits at 38.8.
… Continue reading the full article at the original source below.
This content is automatically aggregated. Full credit goes to the original publisher (coincentral.com).