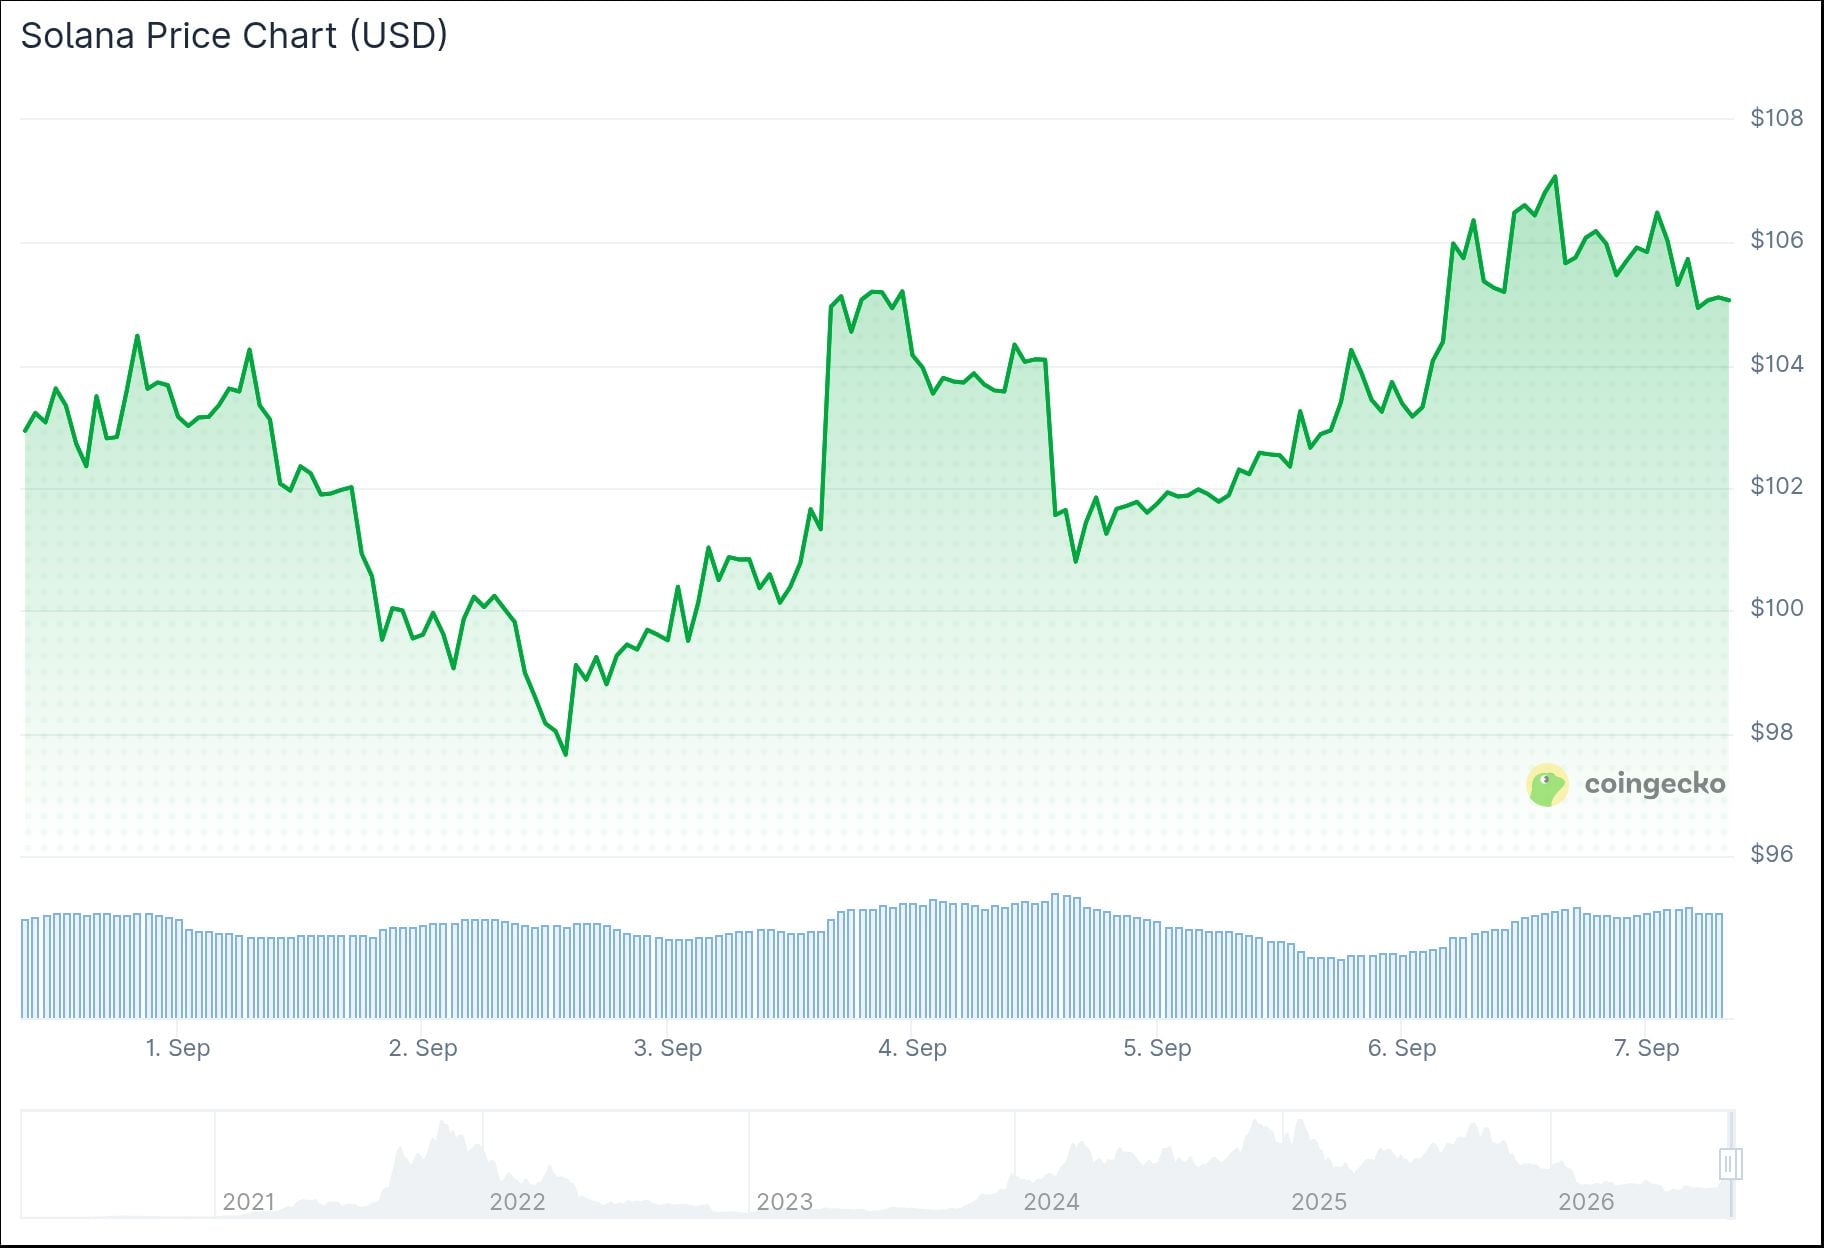
Solana Crypto Stalls Near $108 as Bullish Momentum Fades

Trading near $106.98 on September 6, 2026, Solana crypto sits at a decisive resistance shelf that will likely determine the next directional move. The daily chart shows price stretched above every major moving average, yet momentum gauges are beginning to fade exactly where conviction is most needed.
Key takeaways
- SOL holds comfortably above its 50 and 200-day EMAs, maintaining a textbook bullish stack on the daily timeframe.
- Daily RSI14 at 68.52 flirts with overbought territory while the MACD histogram turns negative at -0.22, signalling decelerating momentum.
- The 107–108.50 resistance band — a confluence of daily R1 and short-term pivots — is the critical zone to watch for the next leg.
- On-chain DEX fee data shows PumpSwap fees up 123.14% in 24 hours, with Raydium, Orca, and BisonFi all posting double-digit monthly gains.
- Daily ATR of 5.75 combined with tight hourly compression suggests volatility is likely to expand sharply from current levels.
Daily Structure: Strong Trend, Cooling Engine
The daily trend remains structurally bullish. Price at 106.98 sits well above the 20-EMA at 97.82, the 50-EMA at 88.91, and the 200-EMA at 89.49 — a clean alignment where the short-term average leads the long-term ones. That is precisely the kind of stack trend-following traders want to see. However, the momentum picture is less straightforward than the trend itself.
… Continue reading the full article at the original source below.
This content is automatically aggregated. Full credit goes to the original publisher (en.cryptonomist.ch).