
Bitcoin Price Analysis: Here’s What the Charts Suggest for BTC Next Week
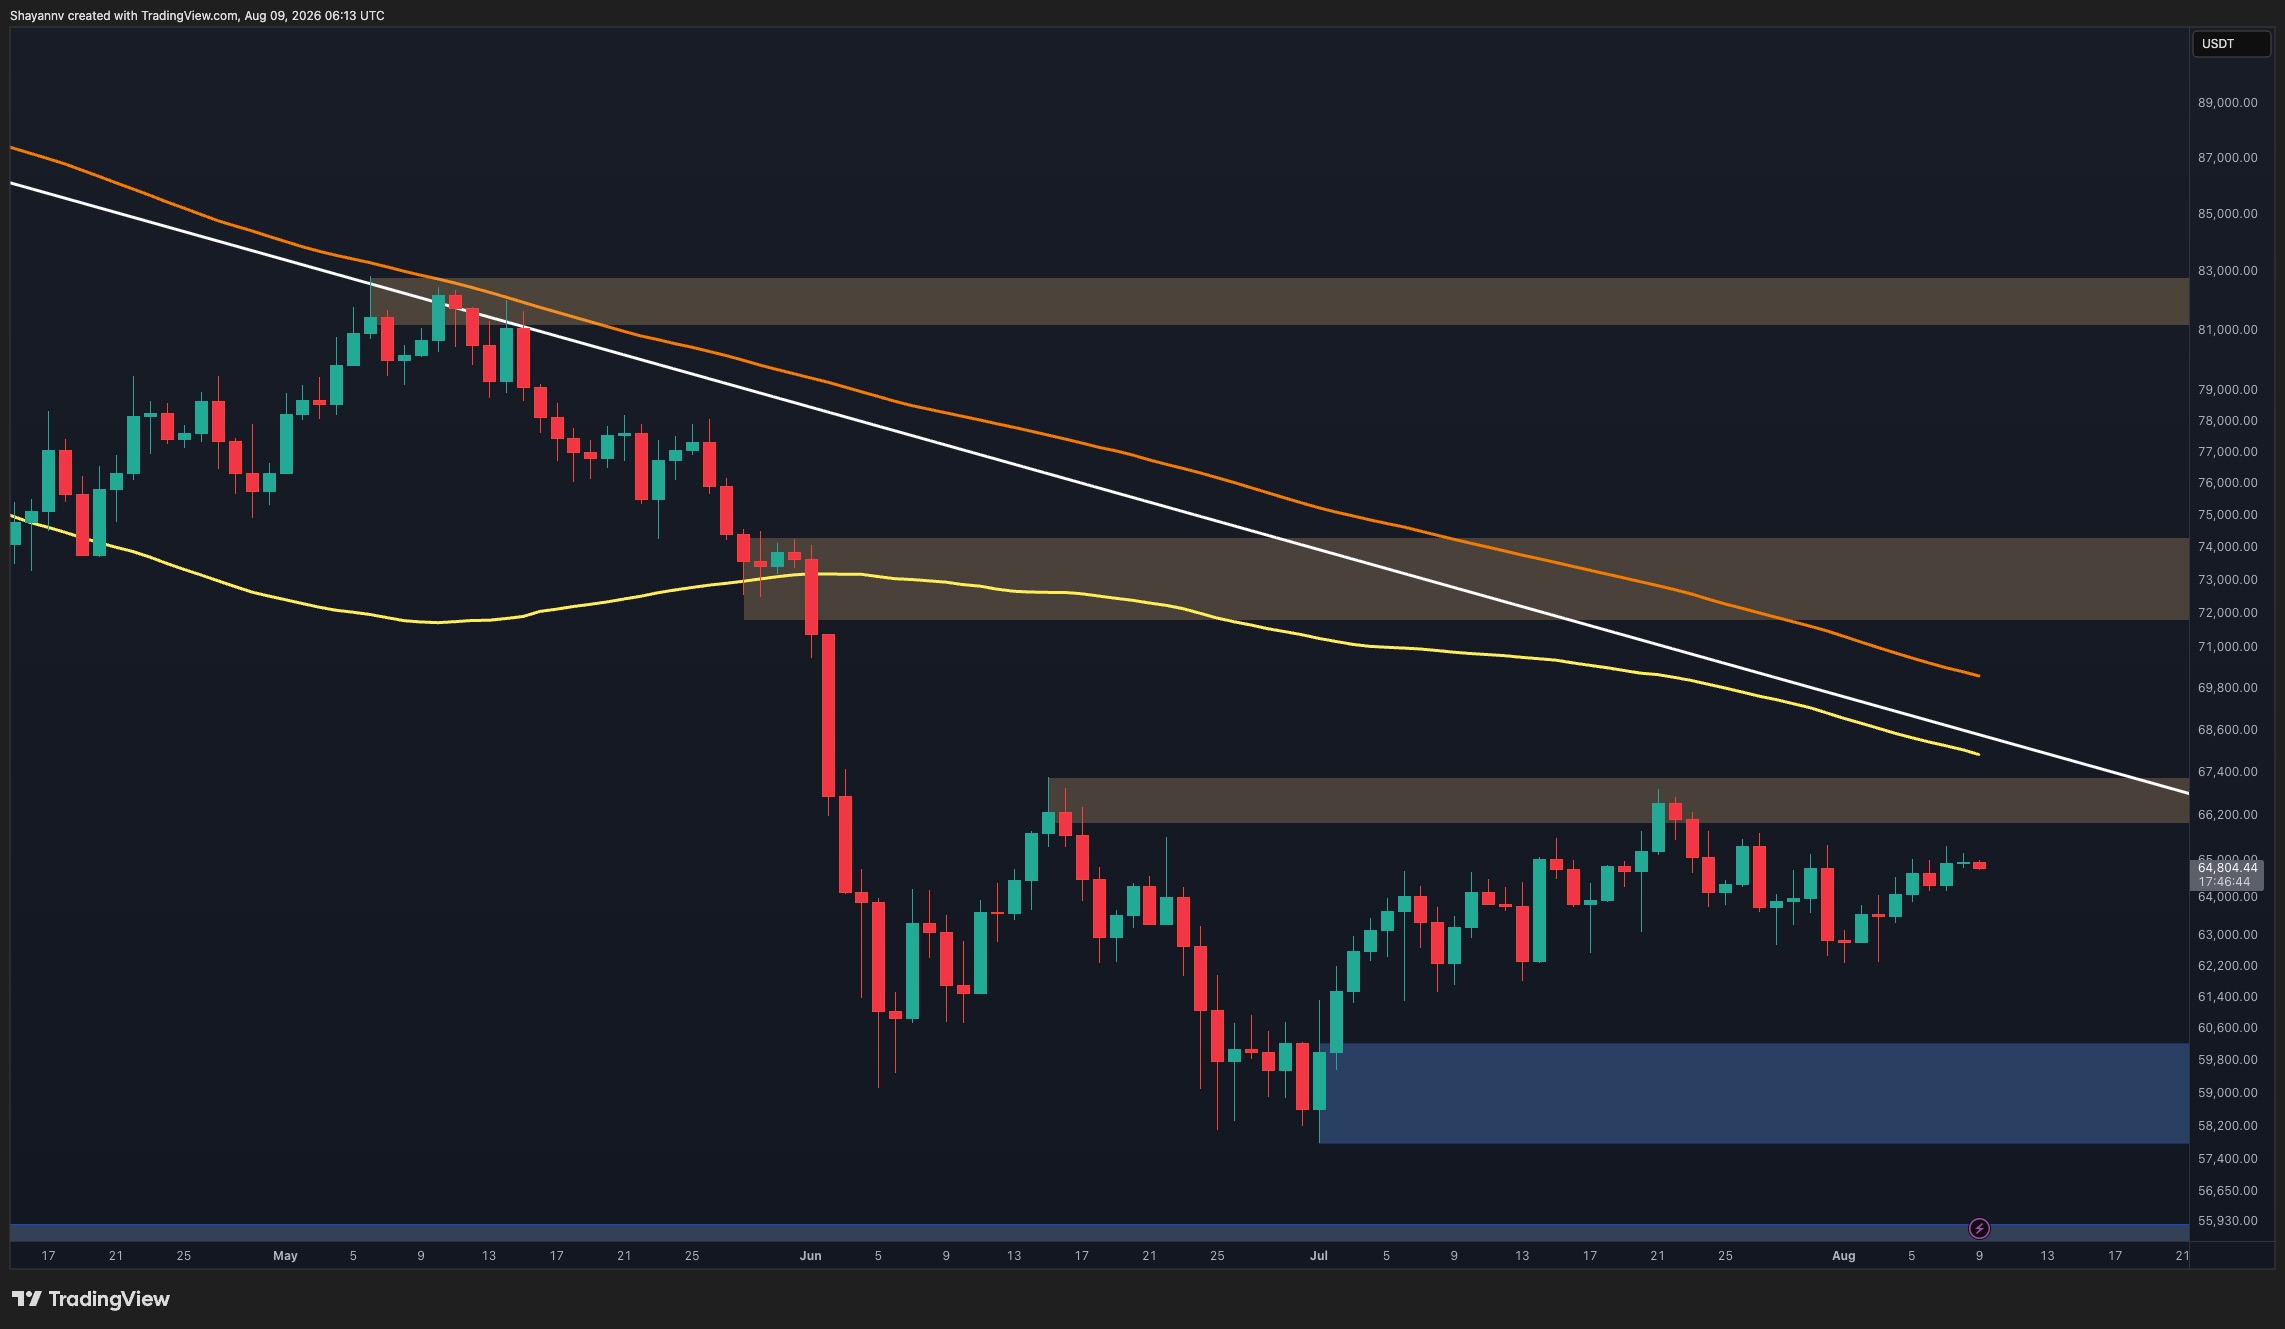
Bitcoin remains trapped in a broader consolidation structure, with the latest recovery failing to generate convincing bullish momentum. The price is again approaching overhead supply, but buyers have yet to produce the type of breakout needed to signal a meaningful structural shift.
Bitcoin Price Analysis: The Daily Chart
On the daily timeframe, BTC is trading around $65K after recovering from the late-June lows. However, the rebound continues to lack strong bullish momentum, with recent candles becoming relatively compressed as the price approaches the $65.8K-$66.8K resistance zone.
This area has already capped previous recovery attempts and is now reinforced by the descending white trendline approaching from above. More importantly, Bitcoin remains well below the declining moving averages, leaving the broader market structure tilted to the bearish side despite the recent stabilization.
Therefore, the current advance still appears more like consolidation beneath resistance than the beginning of a confirmed bullish reversal. A decisive daily breakout above the $65.8K-$66.8K zone and the descending trendline would improve the outlook, while another rejection could shift attention back toward the major $57.8K-$60K demand region.
… Continue reading the full article at the original source below.

