Ethereum Price Analysis: What Are ETH’s Key Levels After the Breakout?
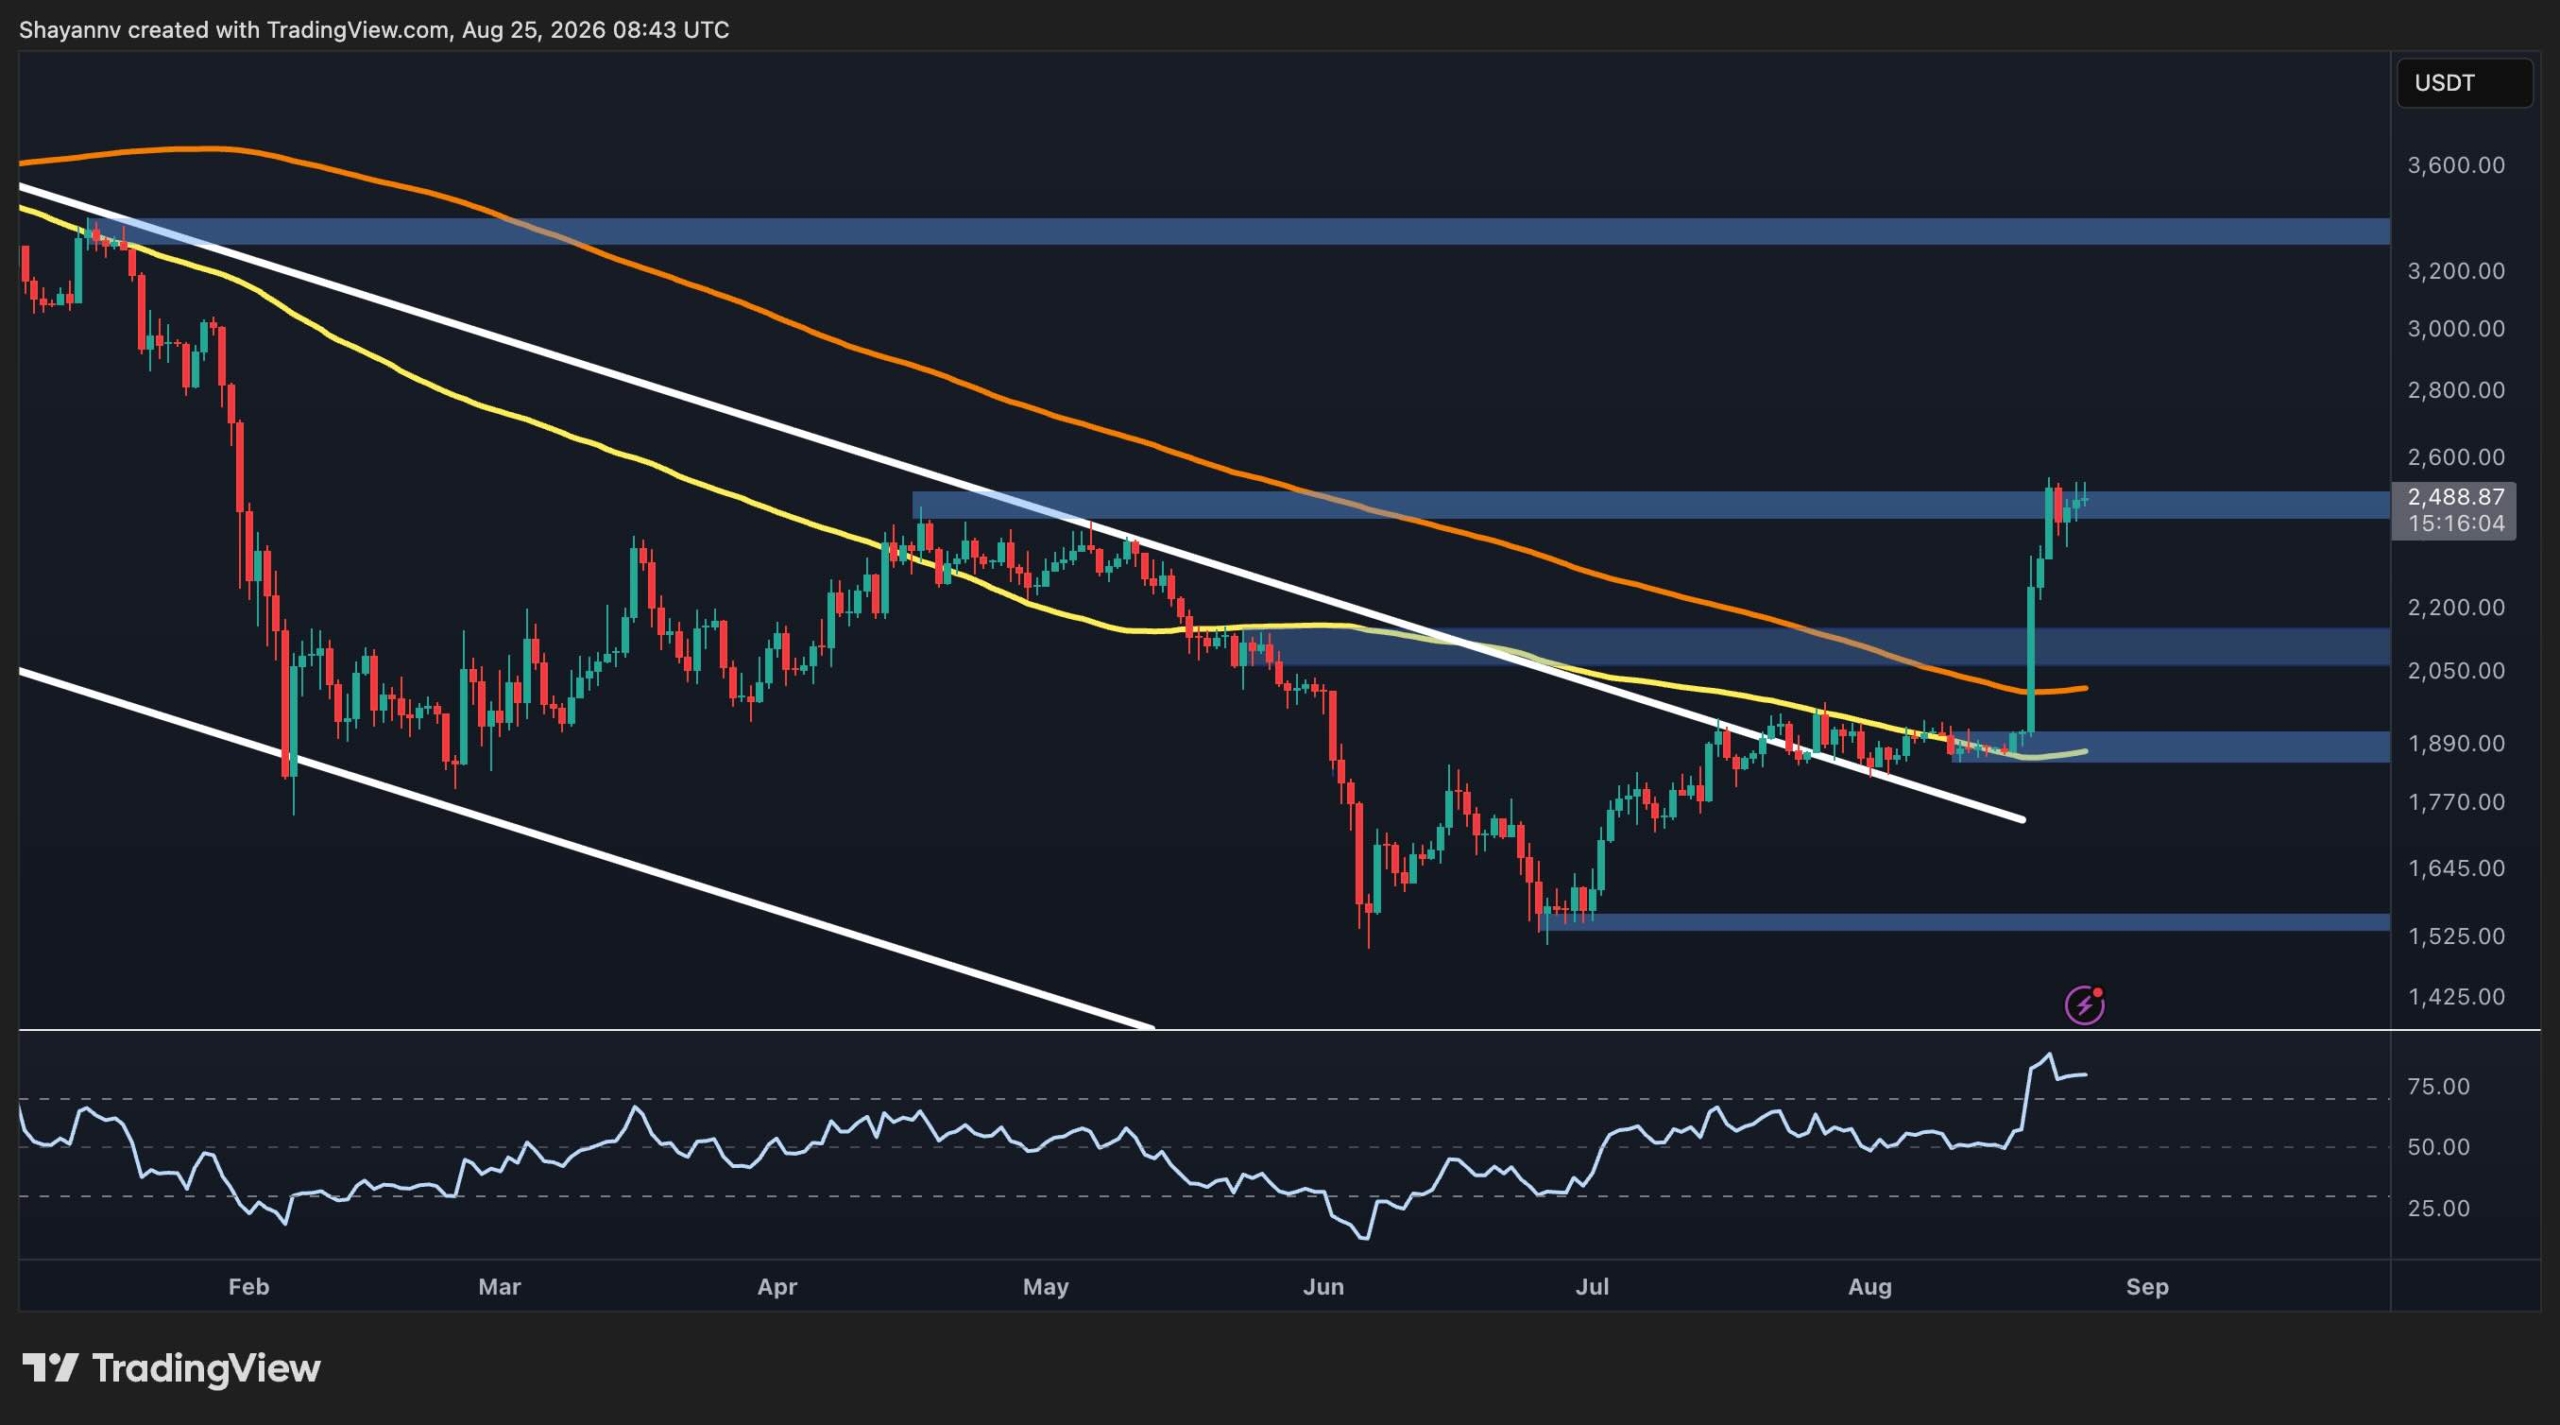
Ethereum has staged a decisive breakout from the multi-week consolidation structure, with ETH now trading just below $2.5K after reclaiming several important resistance levels. The move has significantly improved the higher-timeframe structure, although momentum has become stretched and ETH is currently testing a major resistance zone.
Ethereum Price Analysis: The Daily Chart
The daily chart shows a clear structural improvement. ETH spent much of the summer consolidating between roughly $1.5K and $2K while remaining inside a descending channel. The recent breakout above the upper trendline, the $2.1K resistance zone, and the 100-day and 200-day moving averages represent an important shift in market structure.
The breakout was followed by an exceptionally strong impulsive move toward the $2.5K area. ETH is now trading around $2.49K and testing the major resistance zone extending approximately from $2.45K to $2.5K. This area is particularly important because it has previously acted as a major resistance and is currently being tested after a steep vertical advance. A sustained daily breakout above $2.5K would strengthen the bullish case and could expose the next major resistance region around $3.3K.
… Continue reading the full article at the original source below.