XRP Price: Triangle Breakdown Puts $1 Support in Focus as ETF Outflows Hit
TLDR
- XRP fell 1.29% to $1.0476 on August 6, breaking below a key triangle support pattern
- The Bollinger Band lower boundary at $1.0362 is now the last technical floor before the $1 level
- Spot XRP ETFs recorded $3.58M in outflows on August 5 — the first negative session since July 8
- Derivatives data shows longs absorbed $5.92M in liquidations versus just $120K for shorts
- Analyst ChartNerd flagged August as historically the weakest month for XRP, calling any late-month decline a buying opportunity
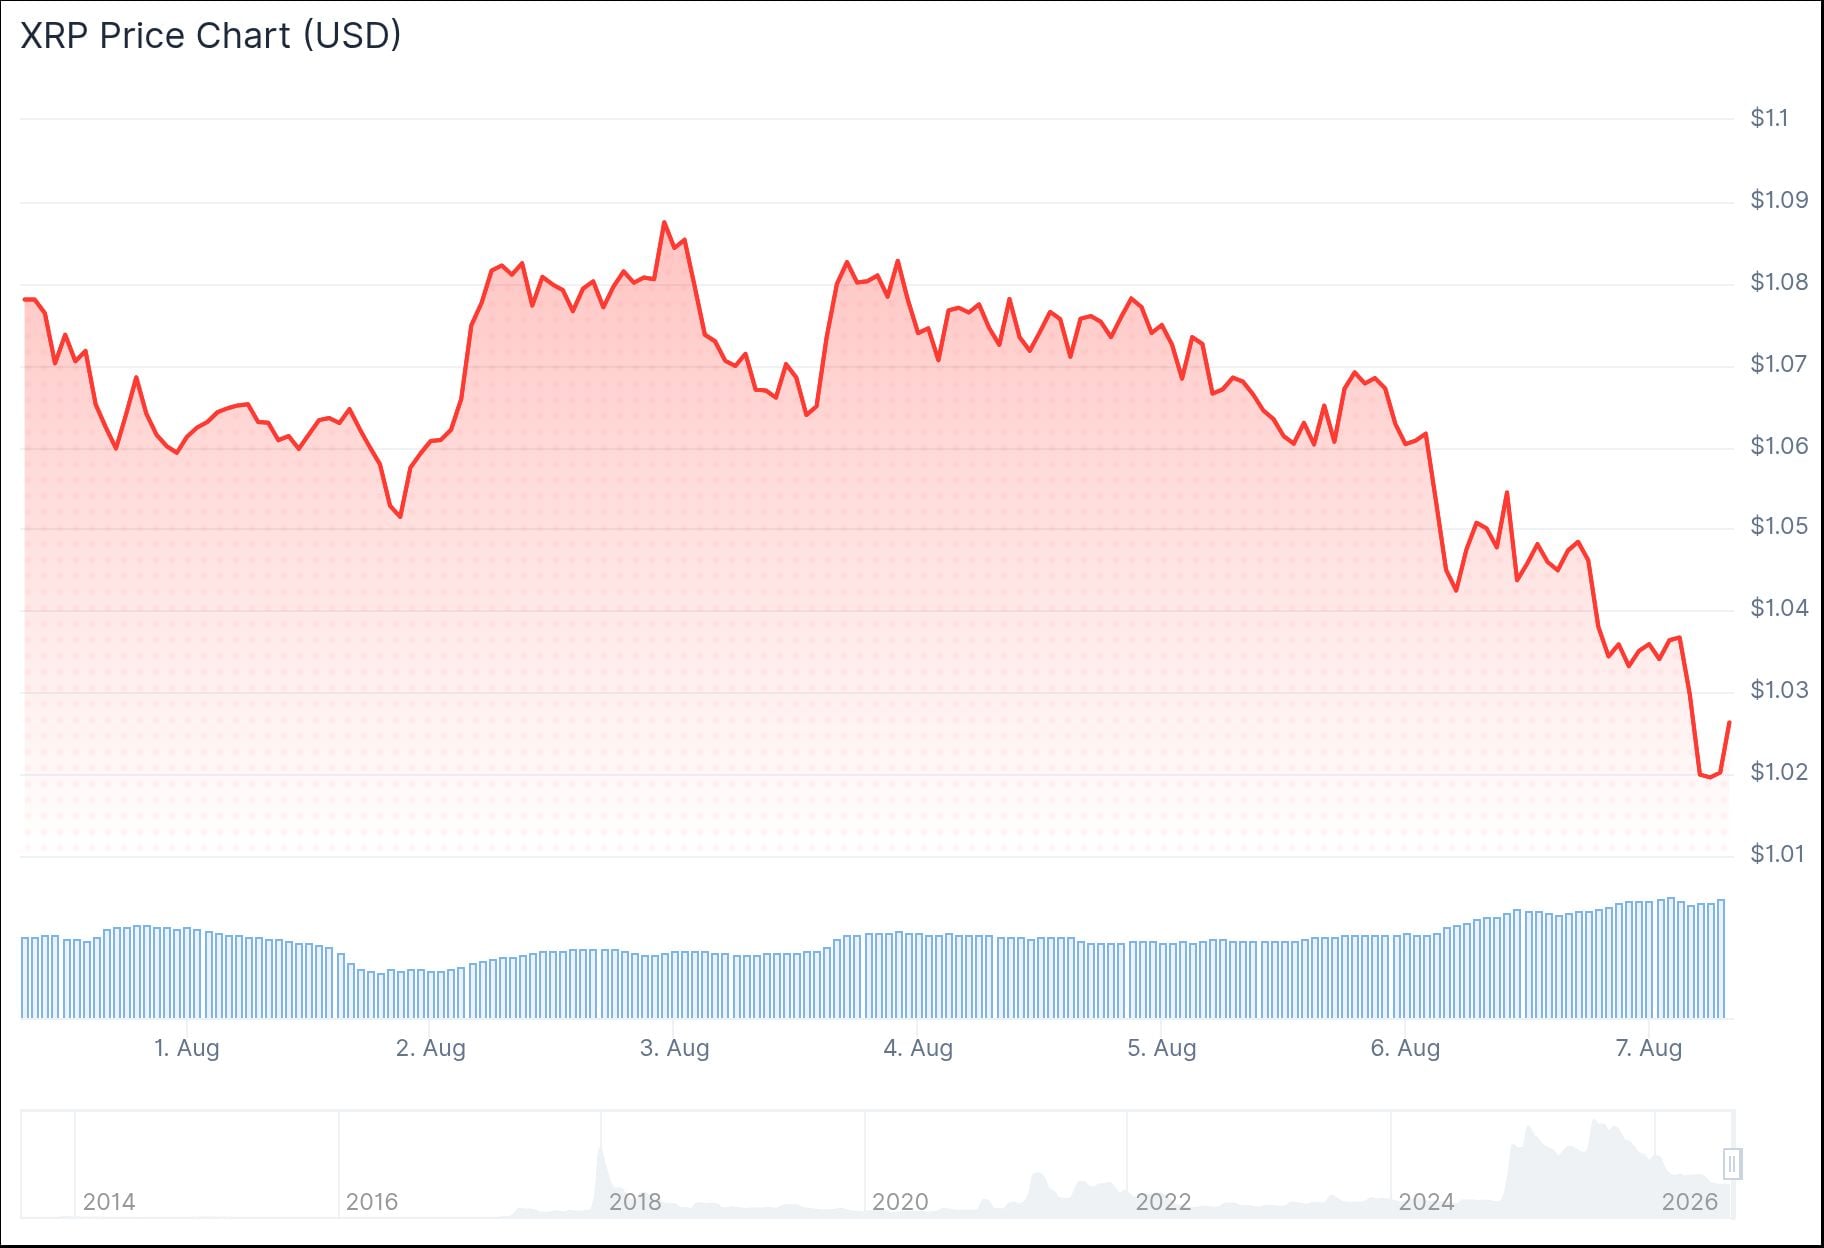
XRP dropped 1.29% to $1.0476 on August 6, its fourth consecutive losing session. The token traded within a 24-hour range of $1.04 to $1.07, with its market cap sitting near $65.5 billion.
The price sits roughly 71% below XRP’s all-time high of $3.65 set on July 17, 2025. That decline has put the token under increasing pressure at a key psychological level.
The daily chart shows XRP breaking below the lower trendline of a triangle pattern that had been forming since May highs above $1.50. Both trendlines had been converging for months, and August 6’s session broke the lower support line.
… Continue reading the full article at the original source below.
This content is automatically aggregated. Full credit goes to the original publisher (coincentral.com).